| 1.3815 |
1.3865 |
1.3895 |
1.3937 |
1.3975 |
1.3995 |
1.4045 |
|
|
| Rolling 30-day USD/CAD Value Areas |
| Extreme Value Buy |
Solid Value Buy |
Good Value Buy |
Spot |
Good Value Sell |
Solid Value Sell |
Extreme Value Sell |
| 1.3705 |
1.3755 |
1.3815 |
1.3937 |
1.4020 |
1.4065 |
1.4135 |
|
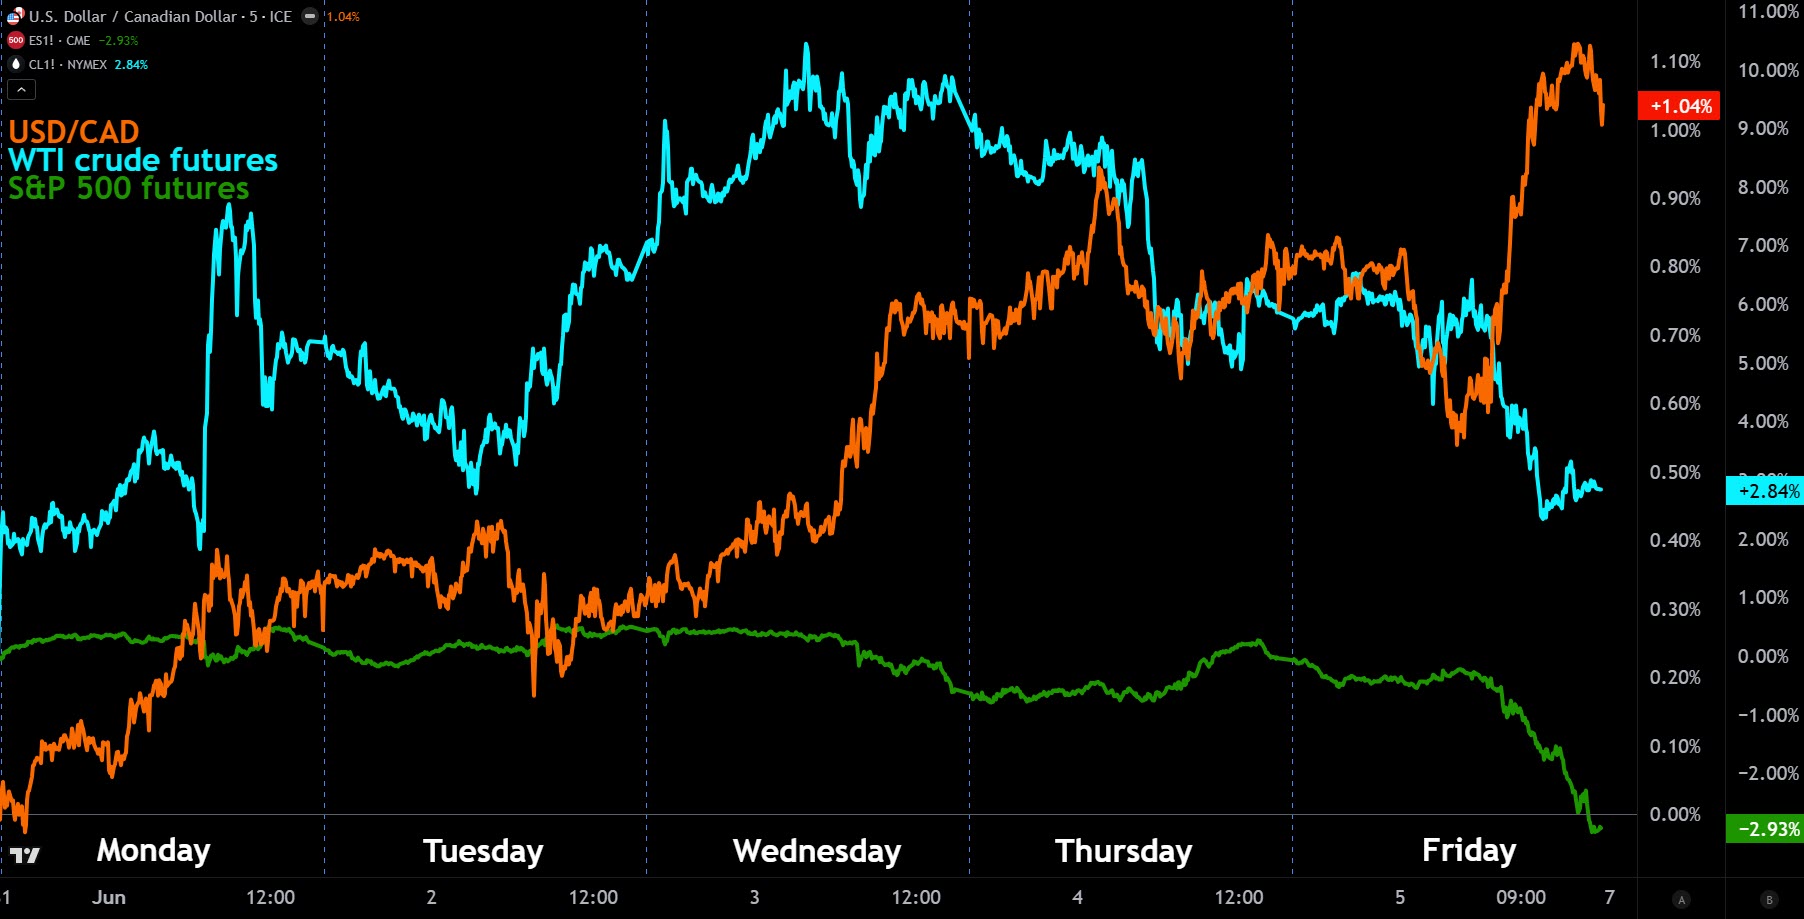
- Monday saw USD/CAD grind higher to start the week, finishing at 1.3836 (+0.31%) as war headlines generated early angst before the mood improved. The market was bounced around on geopolitical news, with WTI crude oil spiking to $94.47 after reports that Iran called off talks until fighting stops in Lebanon. President Trump later announced Israel was halting strikes near Beirut, which helped settle the market. On the data front, the US ISM Manufacturing survey picked up to its best level since 2022 (54.0 vs 53.3 est), though the prices paid component remained extremely high. The combination of strong data and shifting risk sentiment allowed USD/CAD to test 1.3849 before settling near the highs.
- Following Monday's advance, USD/CAD took a breather on Tuesday, chopping sideways to a dead-flat 1.3835 finish in a tight 1.3815–1.3854 range. The US April JOLTS report came in much stronger than expected at 7.618M (vs 6.88M est), suggesting resilient labor demand. However, the bigger story was in equities, where Alphabet's announcement of an $80 billion equity raise highlighted the massive costs of the AI arms race, weighing heavily on tech stocks like Microsoft and Nvidia. The broader US dollar was mixed, and with crude oil trading up to $93.40, USD/CAD simply marked time, failing to break out in either direction despite the strong JOLTS print.
- A broad-based US data beat and a wave of geopolitical angst reignited the dollar rally on Wednesday, pushing USD/CAD up to a 1.3889 close. The US ISM Non-Manufacturing PMI surprised to the upside at 54.5 (est 53.8), while ADP private payrolls expanded by 122K (est 117K). Meanwhile, Canada's Q1 Labour Productivity contracted by 0.5%, reinforcing structural concerns. Geopolitics further fueled the greenback after Iran reportedly targeted a US military ship in the Gulf of Oman, pushing WTI crude up to $96.03. The dollar's haven appeal combined with the diverging economic data sent USD/CAD surging to test the 1.3900 level, topping out at 1.3899 before settling just below the round number.
- USD/CAD ground its way to a fresh high on Thursday, finishing at 1.3900 as the US dollar maintained its broad bid tone despite more peaceful rhetoric out of the Middle East. Markets were cheered by comments from President Trump that the US is in the middle of final negotiations to end the Iran war, alongside a plunge in oil prices down $2.91 to $93.11. On the data front, US Initial Jobless Claims ticked up to 225K (est 213K). Despite the drop in oil and the risk-on tone that pushed the S&P 500 to another record close, USD/CAD held its ground exceptionally well, testing resistance at 1.3925 during the session.
- A blowout US jobs report completely overwhelmed a solid Canadian employment print on Friday, rocketing USD/CAD to a 1.3937 close to cap off a massive 140-pip weekly rally. The US economy added 172K jobs in May, destroying the 85K consensus, while prior months were revised 93K higher and the unemployment rate held at 4.3%. The data sparked a violent repricing in bond markets, sending the US 2-year yield up 10 bps to 4.15% and triggering a steep tech stock meltdown (the NASDAQ's worst day since April 2025). Canada also produced a surprisingly strong report, adding 87.8K jobs (est 10.0K) as the unemployment rate fell to 6.6%. While USDCAD moved modestly lower immediately following the Canadian release, the sheer magnitude of the US beat and the subsequent broad-based USD strength quickly overwhelmed the CAD, driving the pair to a weekly high of 1.3950.
|
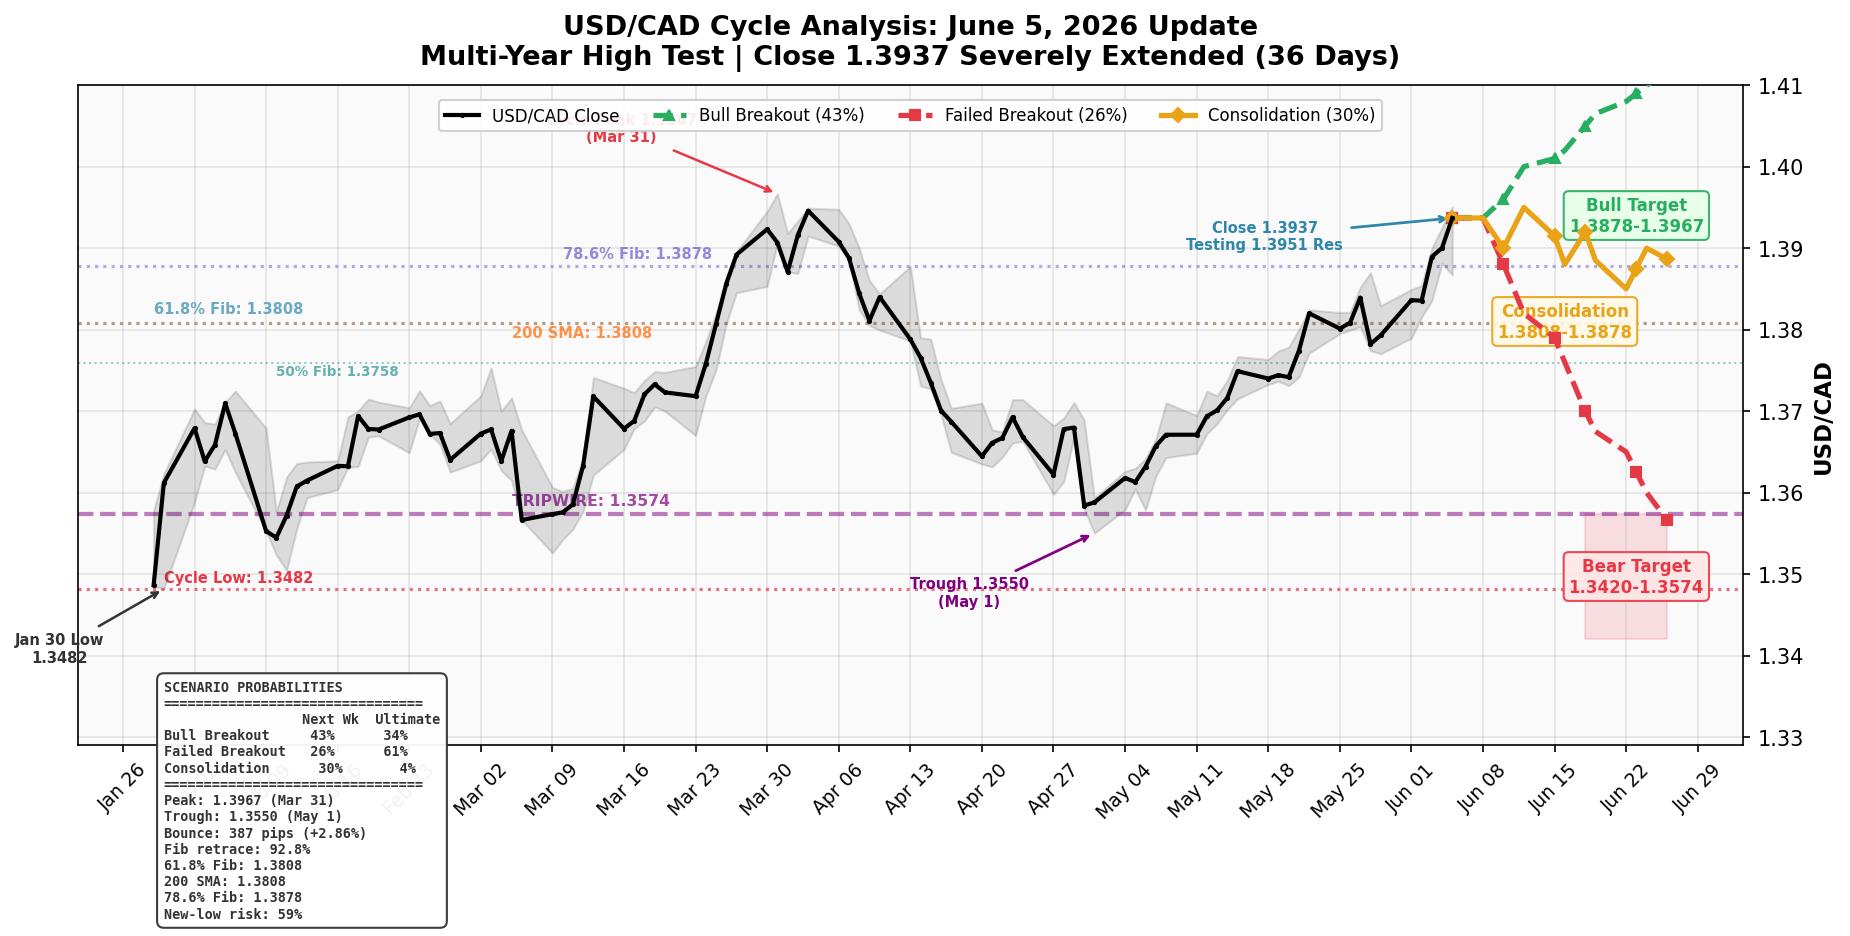
- Cycle Update (June 05): Probing Multi-Year Resistance. USD/CAD closed the week at 1.3937, pressing directly against the critical 1.3951 cycle resistance level established during the current bull run.
Testing the Bull Breakout
After surging 142 pips over the past five sessions, the pair has executed a 96.6% retracement of the prior down leg. The cycle engine indicates that the "Bull Recovery" scenario now carries the highest next-week probability at 43%, as the intense momentum challenges the top end of the consolidation range. However, the time decay factor on this upward leg is massive—at 36 days, it has far exceeded the 14-day median duration for counter-trend rebounds during a bear macro. This means that if bulls fail to secure a decisive close above 1.3951, the ultimate probability of a bear resumption remains high at 61%.
| Consolidation |
30% |
4% |
1.3750 – 1.3951 |
| Bear Resumption |
26% |
61% |
Below 1.3574 |
| Bull Recovery |
43% |
34% |
Above 1.3951 |
Why It Matters
The technical picture is at a critical juncture. The pair is currently trading 186 pips above the 50% Fibonacci retracement level of 1.3750, indicating complete bull control in the near term. A sustained breakout above 1.3951 would formally invalidate the ongoing bear macro structure, forcing a re-evaluation of the long-term trend. Conversely, a rejection here, backed by the 61% ultimate bear probability, would trap late buyers and trigger a sharp reversion toward the moving averages clustered in the 1.3700s.
Macro Context
- The overarching macro context remains BEAR, established by the November to January drop from 1.4140 to 1.3485.
- Macro bear tripwire status remains safely below at 1.3574 (363 pips below spot).
- New-low risk (the probability of eventually breaking below the 1.3481 cycle low) stands at 59%.
Trigger Levels
- Bull trigger: Close above 1.3951 → Targets 1.4000+
- Bear trigger: Break below 1.3750 (50% Fib) → Targets 1.3574
- Neutral: Price between 1.3750 – 1.3951 → Consolidation continues
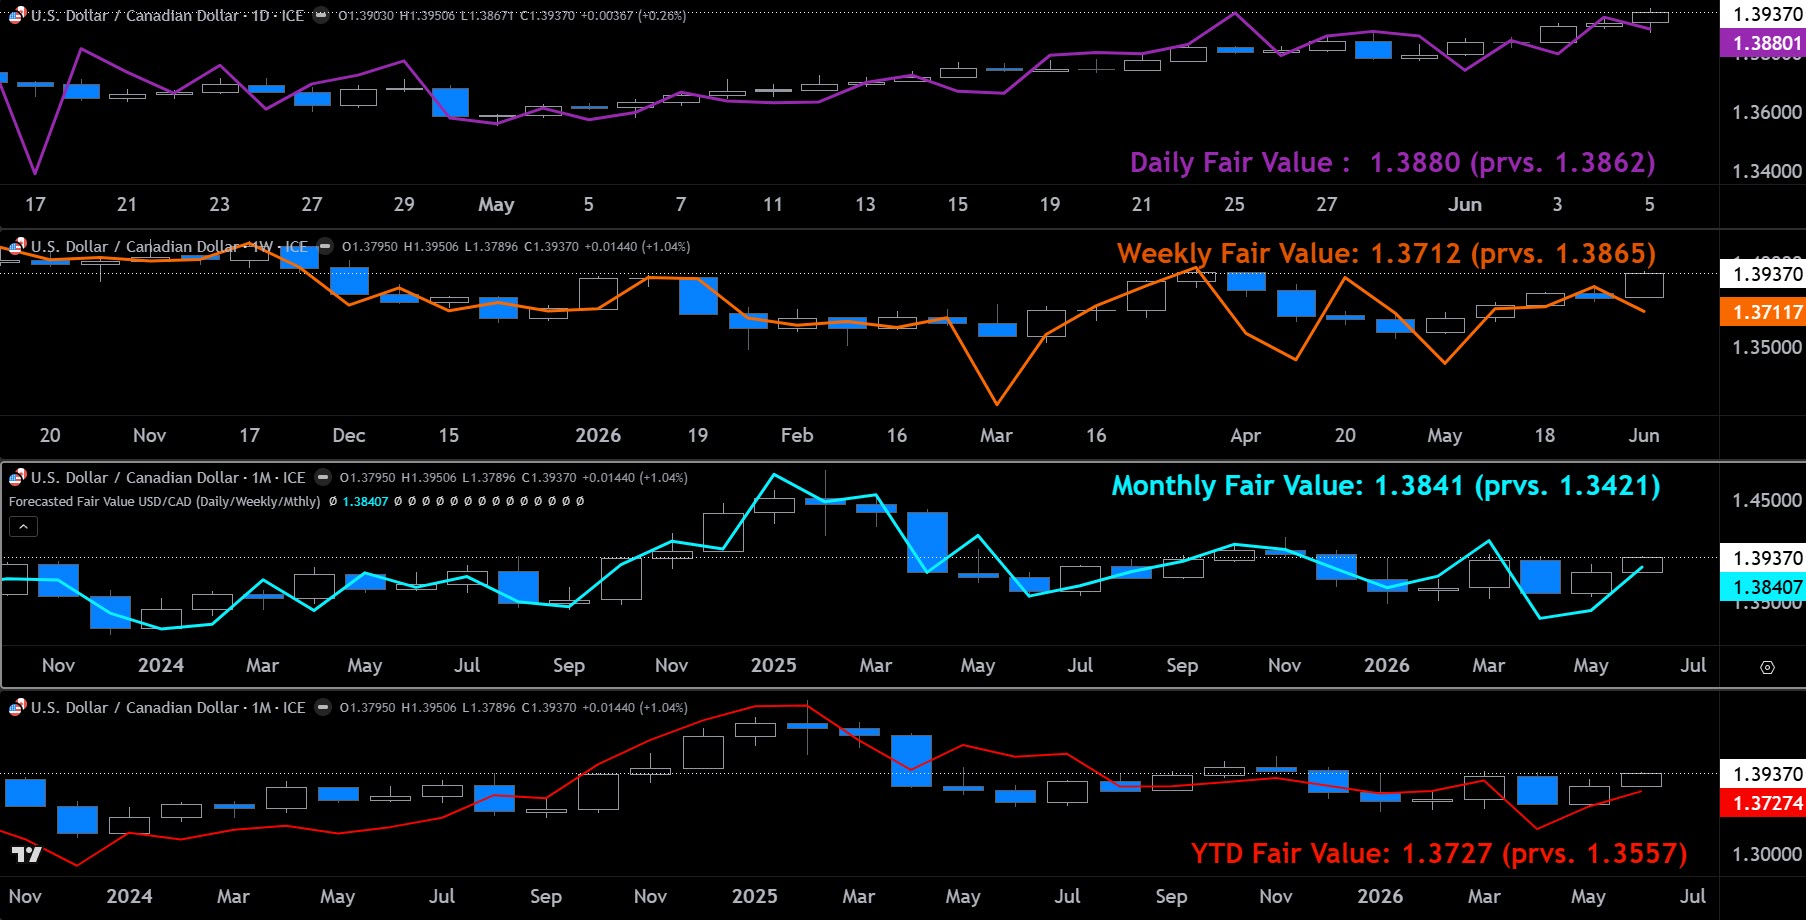
- FX fair value.
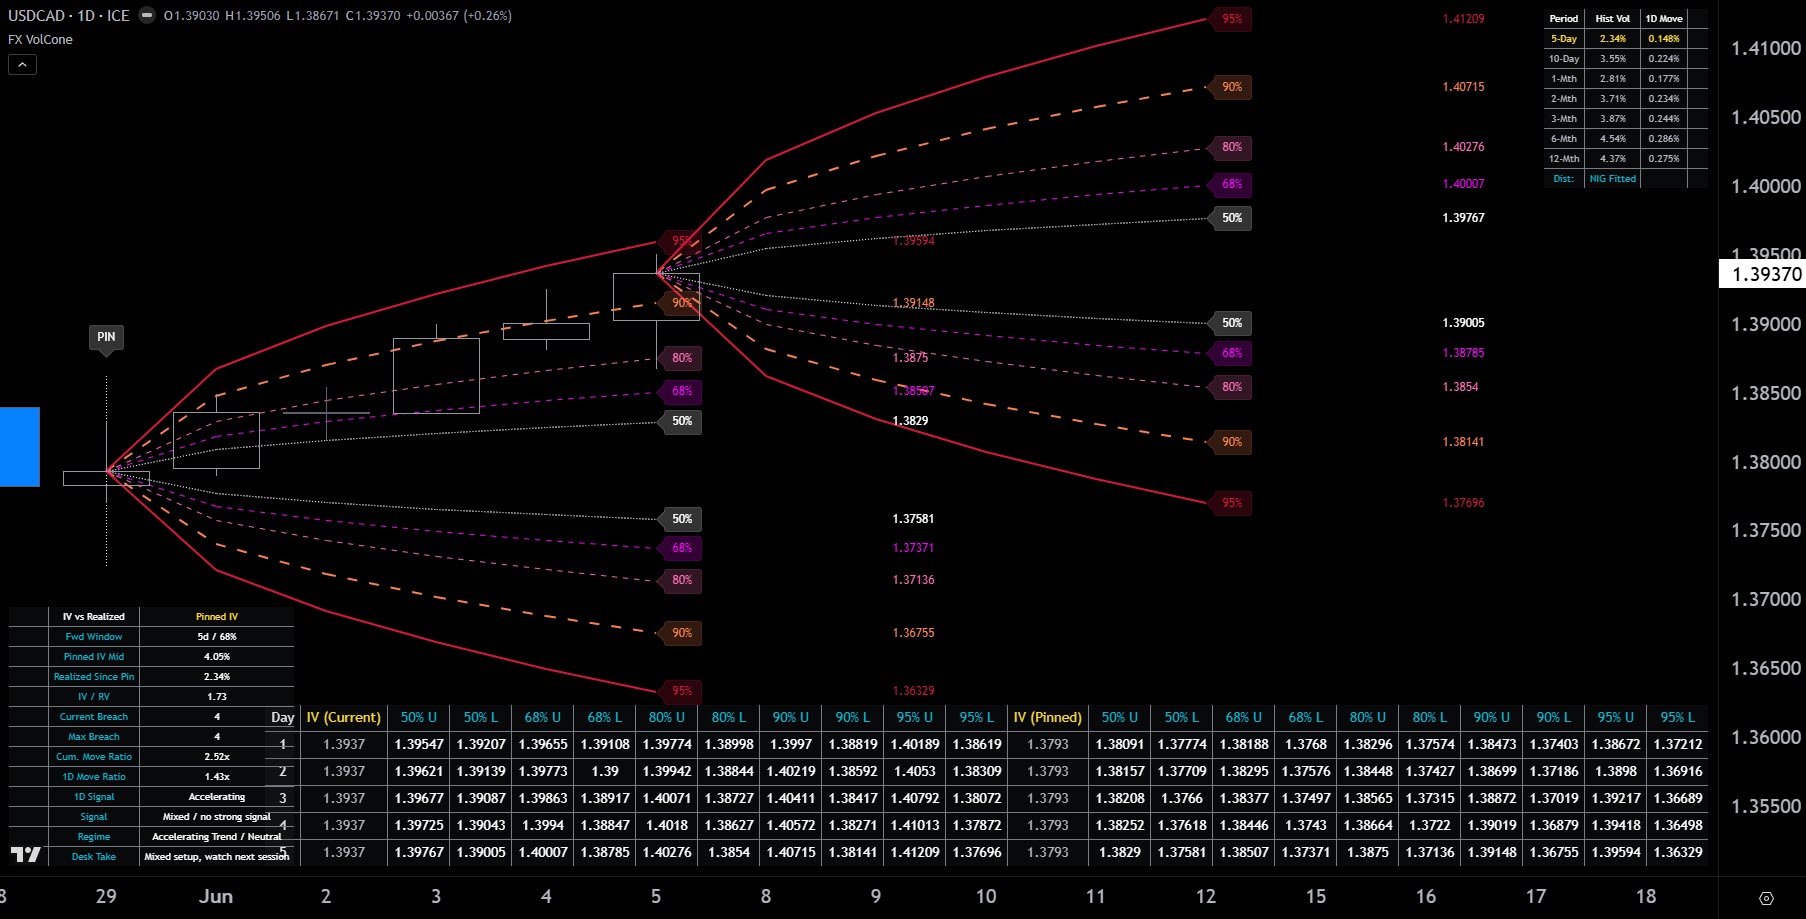
- Options markets are pricing a relatively wide trading band for the week ahead, maintaining a firm upside bias ahead of Wednesday's macro barrage. With mid-implied volatility sitting at roughly 4.3%, the options market is pricing significantly more movement than the 2.3% annualized volatility actually realized over the past five sessions. While USD/CAD surged over 140 pips last week, it was a steady, directional grind rather than erratic chop, which keeps mathematically realized volatility low. Despite last week's options overestimating the day-to-day turbulence, the current pricing is fully justified given the collision of US CPI and the Bank of Canada rate decision on Wednesday. The volatility skew remains firmly positive, indicating that upside risk (USD/CAD calls) continues to command a premium over downside protection. For corporate hedgers, this means the market expects the pair's energetic upward momentum to continue, but downside protection (CAD calls) remains relatively cheap for those needing to lock in current multi-year highs.
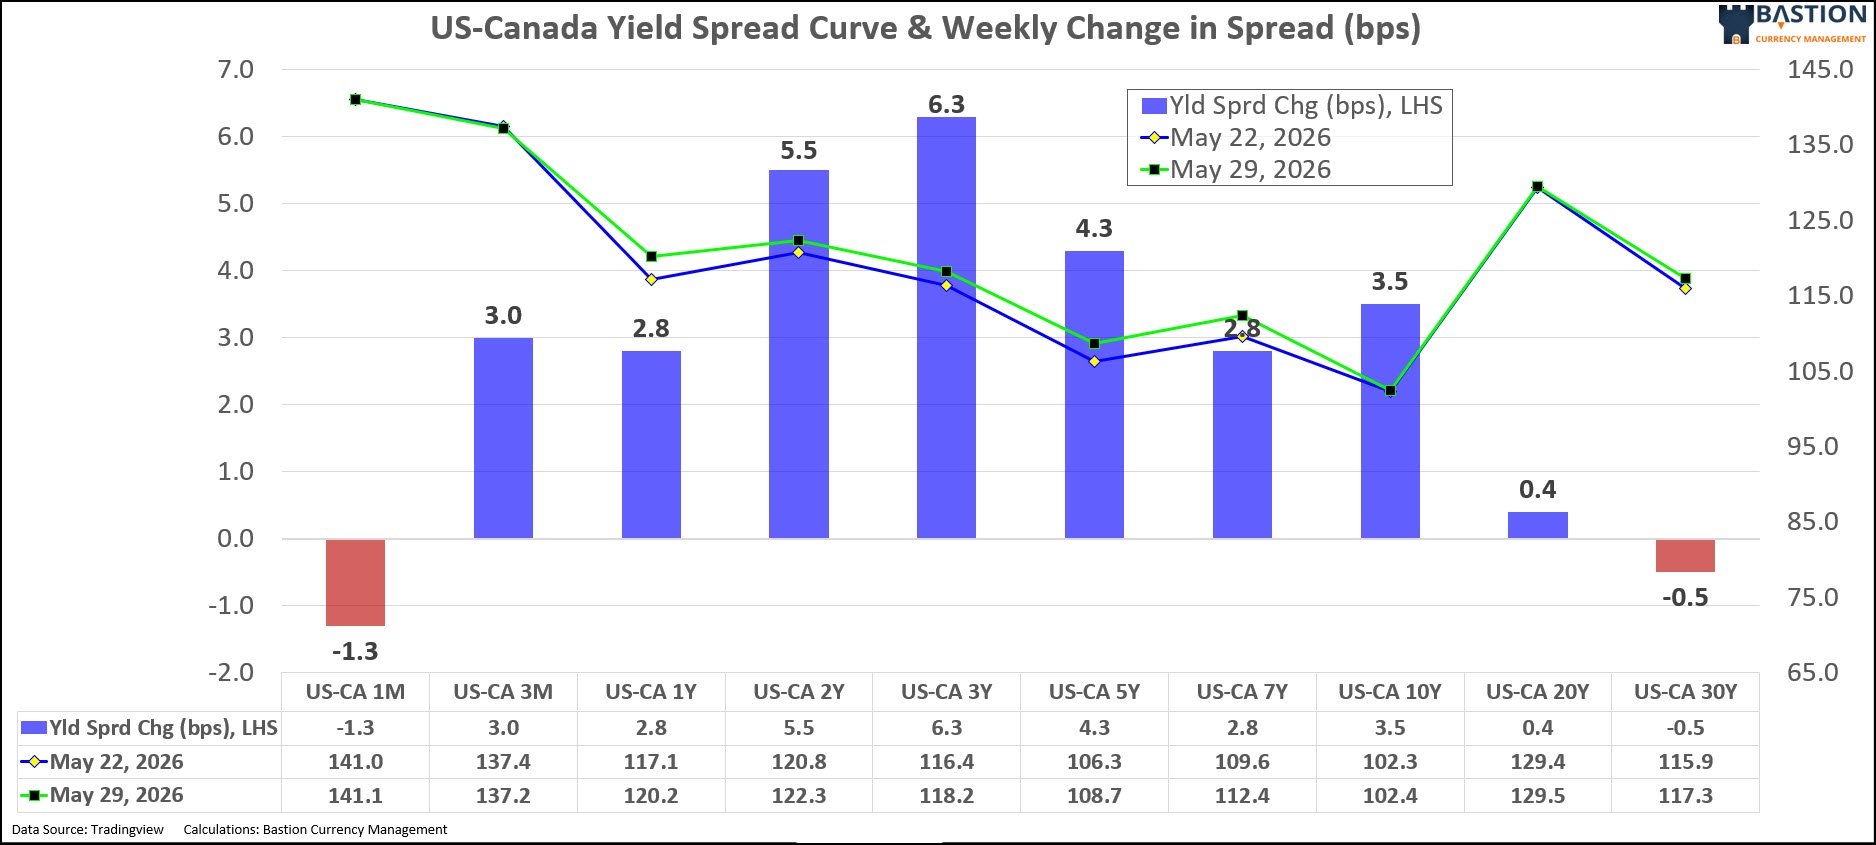
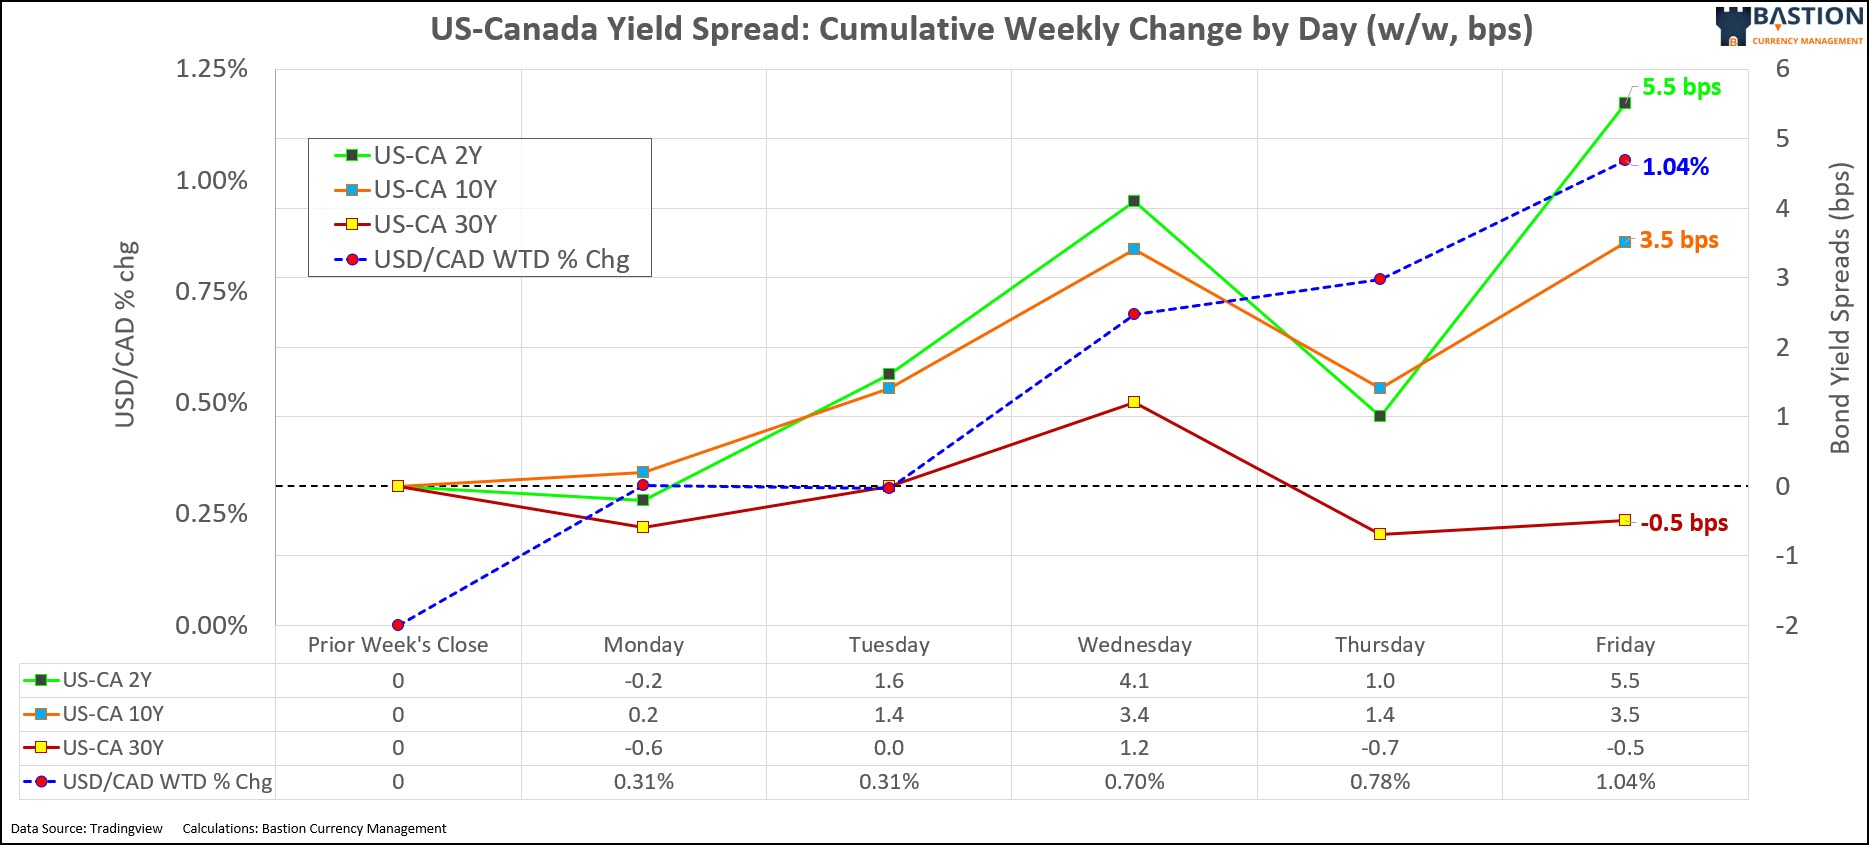
- Widening US-Canada yield spreads provided a powerful tailwind for USD/CAD this week, perfectly aligning with the pair's 144-pip surge. The action was concentrated in the front end and belly of the curve, with the closely watched 2-year spread blowing out by roughly 5.5 basis points to finish at a massive 127.8 bps in the US dollar's favour. The 10-year spread followed suit, widening 3.5 bps to 105.9 bps, as blistering US payrolls and solid manufacturing data contrasted sharply with Canada's dismal Q1 productivity contraction. The long end of the curve was the only holdout, remaining essentially flat, but the sheer magnitude of the front-end divergence provided all the fundamental justification needed for USD/CAD's powerful break to multi-year highs.
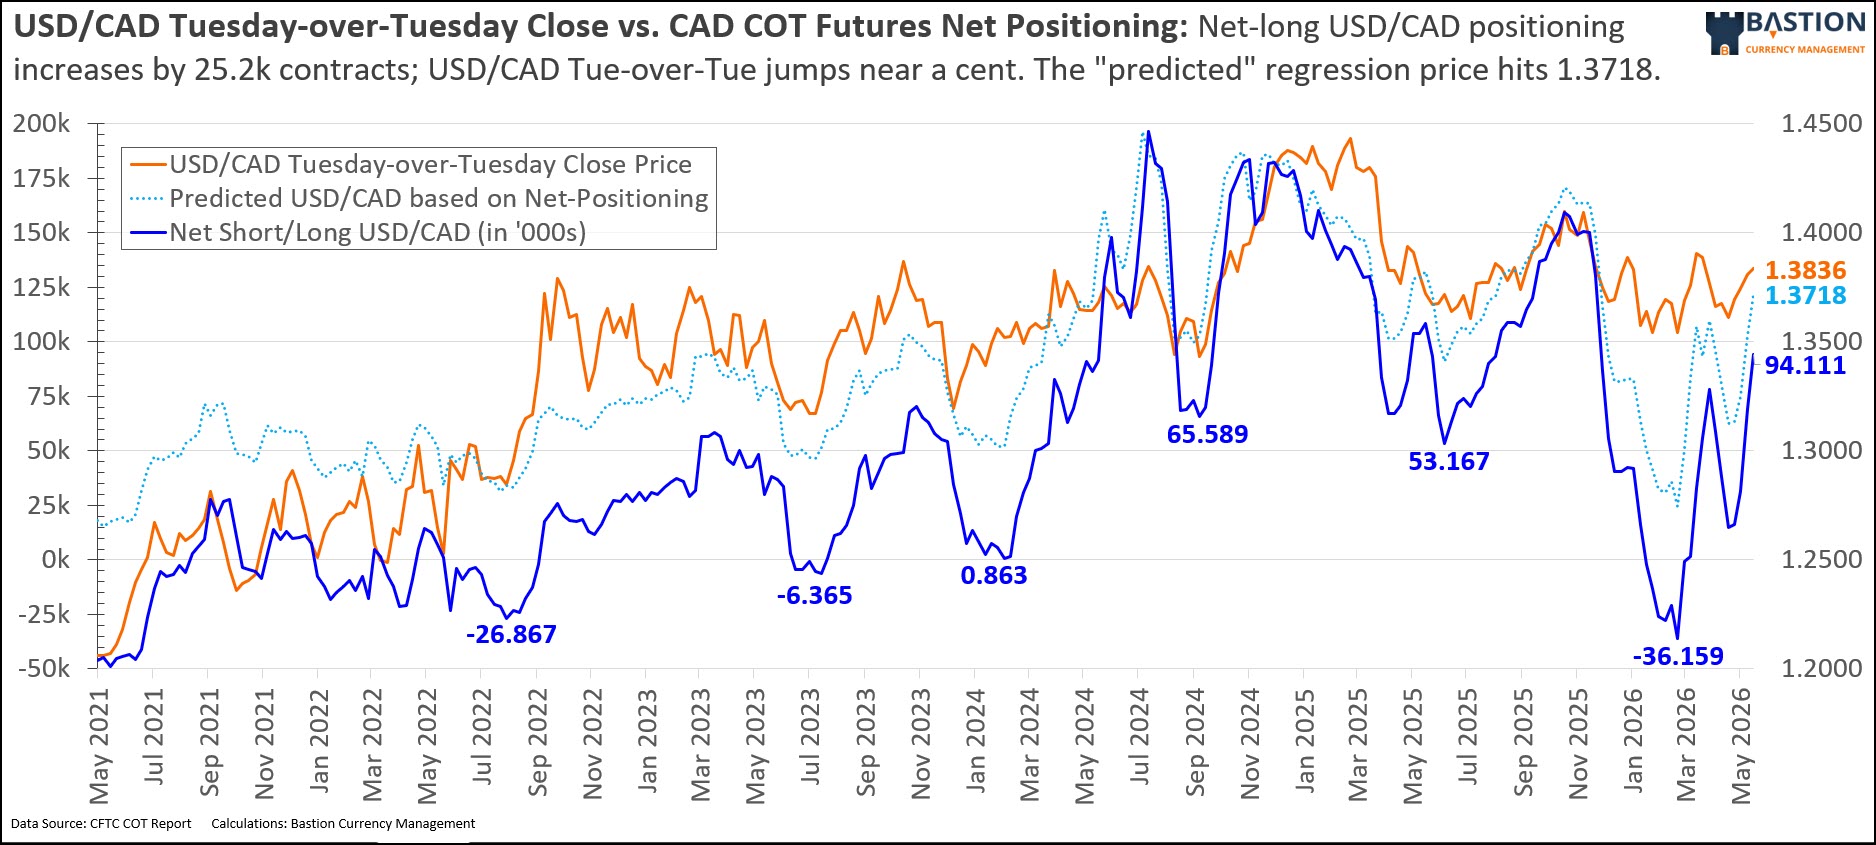
- Professional speculators chased the breakout with conviction, aggressively loading up on long USD/CAD positions into Tuesday's close. According to the latest CFTC COT data, "Pro" traders added another 25.2k net long contracts, pushing their total net long position to 94.1k contracts as the pair stepped 27 pips higher on a Tuesday-over-Tuesday basis. With pros demonstrating a clear trend-following bias and model-driven funds continuing to allocate capital to the USD/CAD upside, this structural smart-money backing provides a solid fundamental floor under the recent multi-year highs.
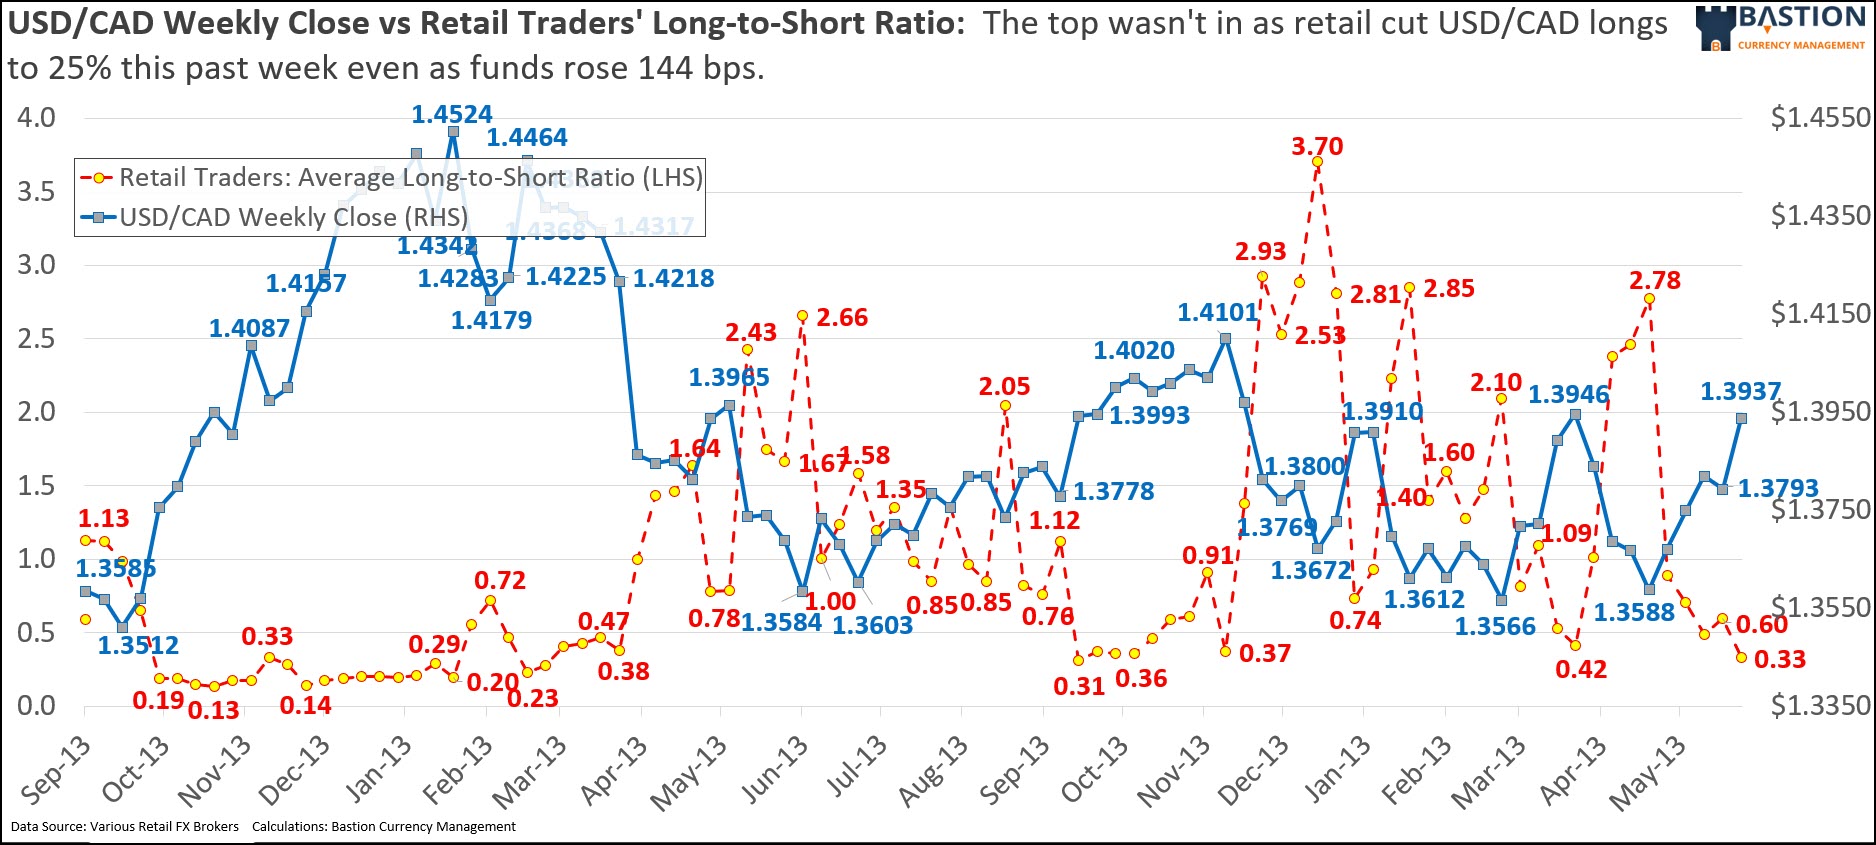
- Retail traders aggressively faded this week's 144-pip surge, heavily selling into the rally and providing a strong contrarian signal for further upside. The proportion of retail traders holding long USD/CAD positions collapsed from 37.3% last week to an extreme 24.9% by Friday's close. According to our 30/70 extreme rule, retail positioning below 30% acts as a potent bullish indicator for the pair. The fact that the retail crowd is desperately trying to top-pick this breakout suggests the rally likely has more room to run before exhausting itself, as the market typically punishes this kind of premature fading.
|
- USD buyers (importers) should be looking to bid 1.3885, taking advantage of any post-BoC volatility to catch a dip toward the 5-day moving average. With the pair surging to multi-year highs at 1.3951 this week, USD buyers have been taken for a painful ride higher. However, cycle analysis indicates that this upward leg is severely extended in duration (36 days vs a 14-day median), suggesting the market is vulnerable to a sharp mean-reversion. Bidding 1.3885 places you just above the 5-day SMA (1.3880) and near the lower edge of the weekly 68% probability band. If you have the luxury of time, a more conservative bid sits at 1.3865, perfectly aligned with the 78.6% Fibonacci retracement of the recent swing, but we suspect that USD/CAD could be driving higher in the near-term, so a conservative bid is likely the better path.
- USD sellers (exporters) should keep offers stacked at 1.3975, aiming to capture a volatility spike above current resistance. Exporters have received an absolute gift with this week's 142-pip surge, but the temptation is to hold out for 1.4000. Instead, offering at 1.3975 sits in the "Good Value" zone of the 50% weekly probability band, just below the R1 weekly pivot of 1.3995. With both US CPI and the Bank of Canada rate decision hitting on Wednesday, an erratic spike into the high 1.3900s is highly probable. If you need a fill regardless, locking in current spot rates at 1.3937 is a perfectly valid strategy given the massive cycle time-decay pressure threatening to cap this rally.
|
|
Utilizing FX Option pricing and combining probability theory and statistics, we present below, for the coming week and the upcoming month, what the numbers "suggest" for USD/CAD pricing, ranges, and probabilities using a normal distribution. The option strikes we used are noted inside the parentheses() in the row headers "Prob. Price Above Upper Boundary ( )" for the call option, and "Prob. Price Below Lower Boundary ( )" for the put option.
|
| Prob. Price Above Upper Boundary (1.3990) |
25.45% |
52.46% |
| Prob. Price Below Lower Boundary (1.3877) |
24.13% |
46.85% |
| Implied Range (60% Probability) |
- |
1.3895 - 1.3982 |
| Implied Range (40% Probability) |
- |
1.3870 - 1.4010 |
| Implied Range (30% Probability) |
- |
1.3855 - 1.4027 |
| Implied Range (20% Probability) |
- |
1.3835 - 1.4048 |
| Implied Range (10% Probability) |
- |
1.3807 - 1.4080 |
| Implied Range (5% Probability) |
- |
1.3782 - 1.4108 |
| Prob. Price Being Between Boundaries (1.3877 - 1.3990) |
50.42% |
100% |
| Prob. Either Boundary Touched (1.3877 - 1.3990) |
- |
91.03% |
| Prob. Neither Boundary Touched (1.3877 - 1.3990) |
- |
8.97% |
| Prob. Price Touching Both Boundaries (1.3877 - 1.3990) |
- |
8.22% |
|
| Prob. Price Above Upper Boundary (1.4040) |
25.33% |
54.09% |
| Prob. Price Below Lower Boundary (1.3801) |
24.75% |
46.68% |
| Implied Range (60% Probability) |
- |
1.3846 - 1.4033 |
| Implied Range (40% Probability) |
- |
1.3792 - 1.4091 |
| Implied Range (30% Probability) |
- |
1.3759 - 1.4127 |
| Implied Range (20% Probability) |
- |
1.3717 - 1.4173 |
| Implied Range (10% Probability) |
- |
1.3655 - 1.4240 |
| Implied Range (5% Probability) |
- |
1.3601 - 1.4299 |
| Prob. Price Being Between Boundaries (1.3801 - 1.4040) |
49.92% |
100% |
| Prob. Either Boundary Touched (1.3801 - 1.4040) |
- |
91.81% |
| Prob. Neither Boundary Touched (1.3801 - 1.4040) |
- |
8.19% |
| Prob. Price Touching Both Boundaries (1.3801 - 1.4040) |
- |
8.77% |
|
|
Definitions: "At Period End" means that the prices/probabilities represented under that header are expected to be relevant on that terminal day. In contrast, "At Any Time During Period" suggests that the numbers in the column below the header are likely to occur and be valid at any point during the date range given. "Prob. Price Above Upper Boundary" is the chance that the price will close above the upper boundary at the final date irrespective of where it may trade up until then. "Prob. Price Below Lower Boundary" is the chance that the price will close below the lower boundary at the final date irrespective of where it may trade up until then. "Implied Range (x% Probability)" is the range that the currency is expected to trade within given a certain probability. In other words, an Implied Range (60% probability) suggests that the exchange rate has a 60% chance of staying within that given range (e.g., 1.2500-1.2600) over the time period. "Prob. Price Being Between Boundaries" is the probability the price will end between the two boundaries "At Period End" or the probability the price will trade inside the boundaries "At Any Time During Period". "Prob. Either Boundary Touched" is the probability that either the upper or lower boundary will be touched at any point during the date range specified. Prob. Neither Boundary Touched is the probability that neither the upper nor lower boundary will be touched at any point during the date range specified. Prob. Price Touching Both Boundaries is the probability that both the upper and lower boundary will be touched at some point during the date range specified.
|
Quick Take:
- The Bank of Canada takes center stage on Wednesday with its latest interest rate decision. Markets broadly expect the BoC to hold the overnight rate steady at 2.25%, but the focus will be squarely on Governor Macklem's press conference for hints on future easing.
- US inflation data drops the exact same morning, creating a massive volatility window. The US May CPI report is forecast to show headline inflation heating up to 4.2% y/y, which could send US yields surging right as the BoC decides its path.
- US producer prices follow on Thursday to complete the inflation picture. The PPI data (expected +0.7% m/m) will provide leading indicators for the PCE deflator and could reinforce any dollar strength triggered by Wednesday's CPI print.
- The pair enters the week probing multi-year highs near 1.3950 after Friday's blowout US payrolls. Upward momentum is incredibly strong, and any hawkish surprises from US data could finally force a sustained breakout above the psychological 1.4000 barrier.
We kick things off with the ISM Manufacturing PMI on Monday, a critical gauge of input costs. The headline index is forecast to edge up to 53.3 from 52.7, but the real story is the prices paid component, which surged to a multi-year high of 84.6 last month. With the Middle East conflict continuing to disrupt global shipping and energy markets, any further acceleration in manufacturing costs will heavily reinforce the Fed's restrictive stance. Fed Governor Waller is also scheduled to speak; given his recent hawkish pivot advocating for the removal of the FOMC's easing bias, expect his comments to keep the short end of the US curve firmly elevated, providing baseline support for the US dollar.
Tuesday's calendar is light on tier-one data, leaving the JOLTS job openings report to set the tone. The consensus expects job openings to slip slightly to 6.80 million from the prior 6.86 million, pointing to a gradual cooling in labor demand. However, FOMC member Kashkari is scheduled to hit the tape, and his recent framing of the Middle East conflict as an “inflationary shockwave” suggests he will maintain his firmly neutral outlook. With the Fed funds rate sitting tight at 3.50% to 3.75%, Kashkari's reluctance to signal any near-term easing should keep the two-year US-Canada rate spread comfortably wide in the dollar's favor.
The services sector takes center stage on Wednesday with the ISM Non-Manufacturing PMI. The index is expected to hold steady at 53.6, but again, the prices component (which printed at a hot 70.7 last month) will be heavily scrutinized for pass-through inflation. We also get the ADP employment change pulse (consensus 110K versus 109K prior), offering an early look at private payrolls ahead of Friday. In the afternoon, the Fed's Beige Book will provide anecdotal color on how deeply the recent energy spikes and the looming July USMCA tariff reviews are biting into corporate margins.
Digestion day arrives on Thursday, with the focus squarely on US labor market resilience. Initial jobless claims will be the main event after last week's 215K print. The narrative here remains that despite restrictive monetary policy, mass layoffs haven't materialized. We also hear from Fed's Daly, who has championed a balanced, patient approach to policy without over-tightening. Assuming claims remain contained in the low 200K range, the fundamental backdrop of US economic exceptionalism relative to Canada's sputtering growth should keep USD/CAD insulated from deep corrections.
A massive cross-border jobs showdown closes out the week on Friday. The US nonfarm payrolls consensus is calling for a sluggish 95K additions (down from 115K prior), while the US unemployment rate is expected to hold steady at 4.3%. North of the border, Canada's employment report is forecast to add 10.2K jobs after a brutal 17.7K loss last month. Given Canada's dismal Q1 GDP contraction, a miss on the Canadian jobs front would severely amplify dovish pressure on the BoC ahead of their June 10 meeting, even if they remain paralyzed by inflation. Conversely, a soft US print could spark a sharp risk-on dollar selloff.
Wrapping up, USD/CAD heads into the new week trading near 1.3795 following a violent, geopolitically driven whipsaw. The fundamental realities heavily favor the greenback: the US economy remains broadly resilient while Canada has slipped into a technical recession, and the Fed is being forced into a hawkish corner by energy shocks while the BoC is trapped. However, given the extreme headline sensitivity surrounding the Middle East peace talks and fluctuating oil prices, we expect USD/CAD to remain highly erratic within a 1.3700 to 1.3850 range. For corporate hedgers, the trade is to buy USD on dips toward the mid-1.37s, as the structural rate differentials and USMCA tariff risks place a firm floor under the pair.
|
Monday, June 08 2026
| 06:00 |
CAD |
Low |
Leading Index (m/m) (May) |
|
|
0.06% |
|
| 11:00 |
USD |
Moderate |
NY Fed 1-Year Consumer Inflation Expectations (May) |
|
|
3.6% |
|
Tuesday, June 09 2026
| 08:15 |
USD |
Moderate |
ADP Employment Change Weekly |
|
|
35.75K |
|
| 08:30 |
CAD |
Low |
Exports (Apr) |
|
|
72.77 bln |
|
| 08:30 |
USD |
Moderate |
Exports (Apr) |
|
|
320.90 bln |
|
| 08:30 |
CAD |
Low |
Imports (Apr) |
|
|
70.99 bln |
|
| 08:30 |
USD |
Moderate |
Imports (Apr) |
|
|
381.20 bln |
|
| 08:30 |
CAD |
Moderate |
Trade Balance (Apr) |
|
|
1.78 bln |
|
| 08:30 |
USD |
Moderate |
Trade Balance (Apr) |
|
-55.20 bln |
-60.30 bln |
|
| 10:00 |
USD |
High |
Existing Home Sales (May) |
|
4.08 mln |
4.02 mln |
|
| 10:00 |
USD |
Moderate |
Existing Home Sales (m/m) (May) |
|
|
0.2% |
|
| 11:30 |
USD |
Moderate |
Atlanta Fed GDPNow (Q2) |
|
3.0% |
3.0% |
|
| 12:00 |
USD |
Moderate |
EIA Short-Term Energy Outlook |
|
|
|
|
| 16:30 |
USD |
Moderate |
API Weekly Crude Oil Stock |
|
|
-6.750 mln |
|
Wednesday, June 10 2026
| 06:00 |
USD |
Moderate |
OPEC Monthly Report |
|
|
|
|
| 08:30 |
USD |
High |
CPI (m/m) (May) |
|
0.3% |
0.6% |
|
| 08:30 |
USD |
High |
CPI (y/y) (May) |
|
4.2% |
3.8% |
|
| 08:30 |
USD |
High |
Core CPI (m/m) (May) |
|
0.5% |
0.4% |
|
| 08:30 |
USD |
Moderate |
Core CPI (y/y) (May) |
|
2.9% |
2.8% |
|
| 09:45 |
CAD |
High |
BoC Interest Rate Decision |
|
2.25% |
2.25% |
|
| 09:45 |
CAD |
Moderate |
BoC Rate Statement |
|
|
|
|
| 10:30 |
CAD |
Moderate |
BOC Press Conference |
|
|
|
|
| 10:30 |
USD |
High |
Crude Oil Inventories |
|
|
-7.974 mln |
|
| 10:30 |
USD |
Moderate |
Cushing Crude Oil Inventories |
|
|
-0.583 mln |
|
| 11:00 |
CAD |
Low |
Thomson Reuters IPSOS PCSI (Jun) |
|
|
47.58 |
|
| 14:00 |
USD |
Moderate |
Federal Budget Balance (May) |
|
|
215.0 bln |
|
Thursday, June 11 2026
| 08:15 |
EUR |
High |
Deposit Facility Rate (Jun) |
|
2.25% |
2.00% |
|
| 08:15 |
EUR |
High |
ECB Interest Rate Decision (Jun) |
|
2.40% |
2.15% |
|
| 08:30 |
CAD |
Moderate |
Building Permits (m/m) (Apr) |
|
|
10.3% |
|
| 08:30 |
USD |
Moderate |
Continuing Jobless Claims |
|
|
1,777K |
|
| 08:30 |
USD |
Moderate |
Core PPI (m/m) (May) |
|
0.5% |
1.0% |
|
| 08:30 |
USD |
High |
Initial Jobless Claims |
|
|
225K |
|
| 08:30 |
USD |
High |
PPI (m/m) (May) |
|
0.7% |
1.4% |
|
| 08:45 |
EUR |
High |
ECB Press Conference |
|
|
|
|
Friday, June 12 2026
| 08:30 |
CAD |
Low |
Capacity Utilization Rate (Q1) |
|
|
78.5% |
|
| 08:30 |
CAD |
Low |
Manufacturing Sales (m/m) (Apr) |
|
4.6% |
3.0% |
|
| 08:30 |
CAD |
Low |
New Motor Vehicle Sales (m/m) (Apr) |
|
|
176.5K |
|
| 08:30 |
CAD |
Moderate |
Wholesale Sales (m/m) (Apr) |
|
0.1% |
1.9% |
|
| 10:00 |
USD |
Moderate |
Michigan 1-Year Inflation Expectations (Jun) |
|
|
4.8% |
|
| 10:00 |
USD |
Moderate |
Michigan 5-Year Inflation Expectations (Jun) |
|
|
3.9% |
|
| 10:00 |
USD |
Moderate |
Michigan Consumer Expectations (Jun) |
|
|
44.1 |
|
| 10:00 |
USD |
Moderate |
Michigan Consumer Sentiment (Jun) |
|
46.6 |
44.8 |
|
| 13:00 |
USD |
Moderate |
U.S. Baker Hughes Oil Rig Count |
|
|
|
|
| 13:00 |
USD |
Moderate |
U.S. Baker Hughes Total Rig Count |
|
|
|
|
|
|