|
|
As of Friday's close. High/Low and % change are week-over-week figures.
|
| Extreme Value Buy |
Solid Value Buy |
Good Value Buy |
Spot |
Good Value Sell |
Solid Value Sell |
Extreme Value Sell |
| 1.3790 |
1.3830 |
1.3870 |
1.3936 |
1.3960 |
1.3990 |
1.4012 |
|
|
| Rolling 30-day USD/CAD Value Areas |
| Extreme Value Buy |
Solid Value Buy |
Good Value Buy |
Spot |
Good Value Sell |
Solid Value Sell |
Extreme Value Sell |
| 1.3720 |
1.3775 |
1.3825 |
1.3936 |
1.4045 |
1.4100 |
1.4155 |
|
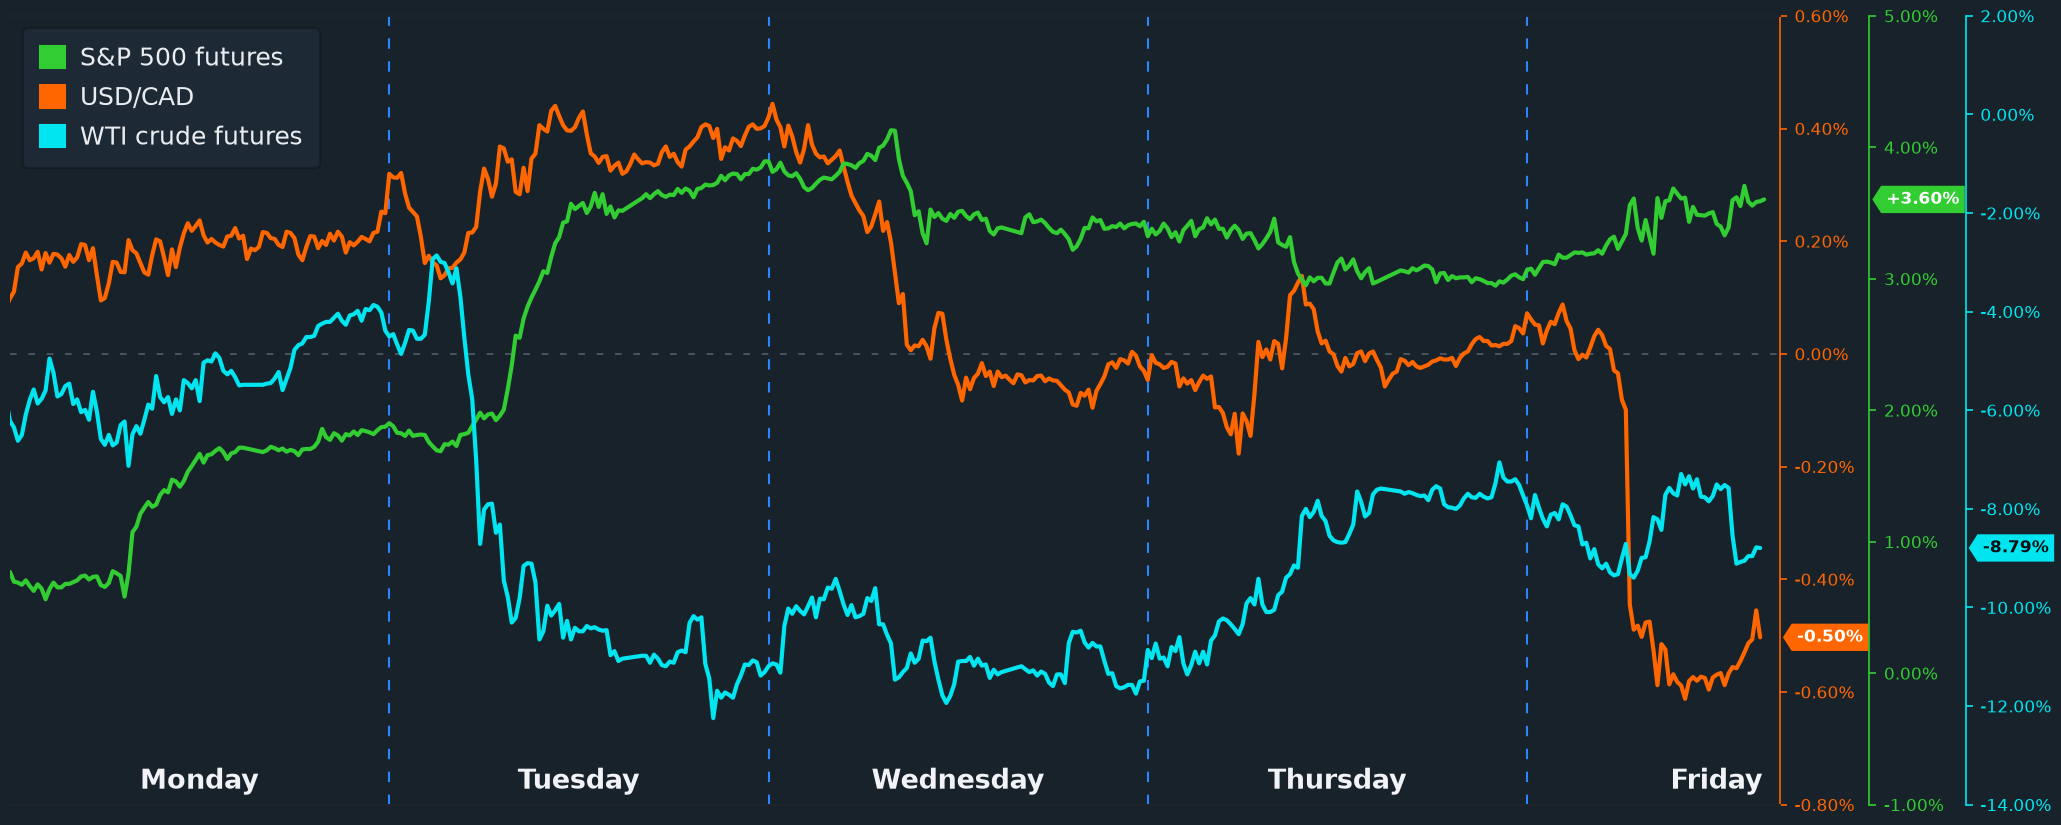
- The strongest US factory survey in more than four years opened August, and USD/CAD still only managed 0.18% to 1.40416 after a 1.4005–1.40535 range. ISM manufacturing printed 55.6 against 54.0 expected and 53.3 prior, its best reading in over four years, with the employment index at 52.8 from 49.7, the first expansion in 33 months, and new orders holding 56.7. Prices paid eased to 71.1 from 73.0 but stayed close to a four-year high, which is the detail that matters: this was a strong-growth, sticky-price survey rather than a clean disinflationary one. The S&P Global manufacturing PMI was 53.9 against 53.8, construction spending fell 0.1% against a 0.2% gain expected, and the Atlanta Fed’s Q3 growth tracker leapt to 6.2% from 5.0%. Yields nonetheless fell across the curve, and the US-Canada 2-year spread narrowed 2.1 basis points with the 10-year down 4.2 and the 30-year down 4.1, so the dollar was not being paid for the data. Crude did the loonie no favours either, WTI settling 5.11% lower at 80.34 as the immediate Middle East supply-disruption premium drained away, while S&P futures rose 1.45% to 7628.25 on a megacap-led tape. That combination, a narrowing rate gap and a 5% oil decline, should have pulled USD/CAD in two directions at once, and it roughly did: the pair spent the session grinding up to 1.40535, tagging last week’s 1.4050 exporter offer on the first day it was live, then closing below the highs.
- Tuesday produced the week’s high at 1.40801 and its only day of spread widening, and USD/CAD closed 0.14% firmer at 1.40611. The US data was soft: JOLTS job openings fell to 7.359M against 7.440M expected and 7.537M prior, factory orders declined 0.3% against a 0.2% gain expected, and the trade deficit was 73.30B against 73.00B. Canada’s own June trade surplus beat at 3.86B against 3.00B and 3.70B prior, and the Atlanta Fed tracker slipped to 5.9%. On paper that mix favoured CAD, and the loonie still lost ground, because the rates market went the other way: the 2-year spread widened 4.8 basis points, the 10-year 5.5 and the 30-year 4.4, the single session all week that restored any of the dollar’s carry advantage. Oil kept working against Canada, WTI shedding another 5.69% to 75.77 as reports of an Iran-Oman framework to reopen the Strait of Hormuz circulated, taking crude down more than 9% in two sessions. Equities were the story elsewhere, with S&P futures up 1.80% to 7765.5 on artificial-intelligence momentum and a well-received megacap earnings run. The 1.40801 high is the level to carry forward: it is the top of the correction’s bounce and it failed on a day when the rate gap was moving in the dollar’s favour, which is a poor advertisement for the upside.
- Services data cracked on Wednesday and USD/CAD gave up 0.37% to 1.40091 after a wide 1.4005–1.40801 range. ADP private payrolls rose just 44K against 68K expected and 95K prior, and the ISM services report was worse beneath the headline than at it: the index itself was 54.1 against 54.5, but the employment component collapsed to 47.4 from 51.2, into outright contraction, while prices paid jumped to 70.3 against 65.0 expected and 67.7 prior. A services sector shedding jobs while charging more is precisely the combination that leaves a central bank without a comfortable option, and it was the first genuine warning of what Friday would confirm. The S&P Global services and composite readings were firmer at 54.6 and 54.5 against 53.6 apiece, which kept the growth picture ambiguous rather than clearly deteriorating. Crude inventories built 2.479M against an expected 1.500M draw, reversing the prior week’s 7.167M drawdown, and Cushing added 2.356M, leaving WTI at 75.22. The 2-year spread narrowed a further 1.6 basis points. The clean signal came from elsewhere: gold surged to 4305.2, a 3.67% single-session gain, the dollar underperformed broadly and the Canadian dollar was among the day’s better performers on that move rather than on anything domestic.
- Thursday was the week’s pause, USD/CAD adding 0.01% to 1.40112 inside a 1.39907–1.40377 range even as the dollar finished the best major. The US data leaned resilient: initial claims were 199K against 203K expected, nonfarm productivity rose 1.4% against 0.6%, and unit labour costs increased just 1.3% against 2.2% expected, a genuinely disinflationary pairing. Continuing claims at 1,801K against 1,790K were the one soft note. US yields rose hard on that mix, the 2-year by more than 7 basis points and the 10-year by close to 6 to 4.67%, and September tightening odds firmed toward 56%. Yet the US-Canada 2-year spread still narrowed 3.3 basis points, because Canadian front-end yields rose faster still, and that is why the dollar’s broad strength barely registered here: USD/CAD was the smallest of the greenback’s gains on the day. Oil reversed sharply, WTI settling 2.75% higher at 77.29 after reports that Iran was considering restricting US and Israeli vessels through the Strait of Hormuz, with further reports of explosions near the strait’s entrance arriving after the settlement. Equities slipped for a second session on a chip and artificial-intelligence unwind, S&P futures easing 0.19% to 7734.75. The pair probed 1.39907 intraday, its first look under 1.3991, and recovered into the close, leaving the week’s decision entirely to the payroll reports.
- Friday delivered the cleanest US-Canada divergence of the year and USD/CAD broke to a new correction low, closing 0.54% lower at 1.3936 after a 1.39259–1.40292 range and 0.58% down on the week. US July nonfarm payrolls contracted 23K against an 85K gain expected, and June was revised down to 20K, so the market lost roughly a hundred thousand jobs of assumed momentum in a single release. Private payrolls added only 30K against 78K, average hourly earnings rose 0.1% on the month and 3.2% on the year against 0.3% and 3.5%, and the unemployment rate fell to 4.1% from 4.2% purely because participation slipped to 61.4% from 61.5%, which is a deterioration dressed as an improvement. The decline was concentrated in local government education, a seasonal quirk rather than a private-sector collapse, but the wage detail left nothing for dollar bulls. Canada printed the mirror image, adding 75.1K jobs against 17.8K expected with the unemployment rate down to 6.4% from 6.5%, gains broad-based across industries and hours worked up 0.6%, though Ivey PMI eased to 55.1 and wage growth slowed. The rates market did the rest: the 2-year spread compressed 8.5 basis points on the day, 8.5 of the week’s 10.7 basis points, to 123.4, and September hike odds fell back below 50%. As last week’s View set out, a softer US report or a Canadian upside surprise would put 1.3950 and 1.3936 back in play, and the pair closed precisely there. WTI recovered 1.15% to 78.18 and S&P futures added 0.58% to 7779.75 for a 3.46% week, while gold closed at 4399.7. USD/CAD ended below the 5-, 10-, 21- and 50-day averages with the 100-day at 1.3911 the only meaningful support left beneath it.
|
-
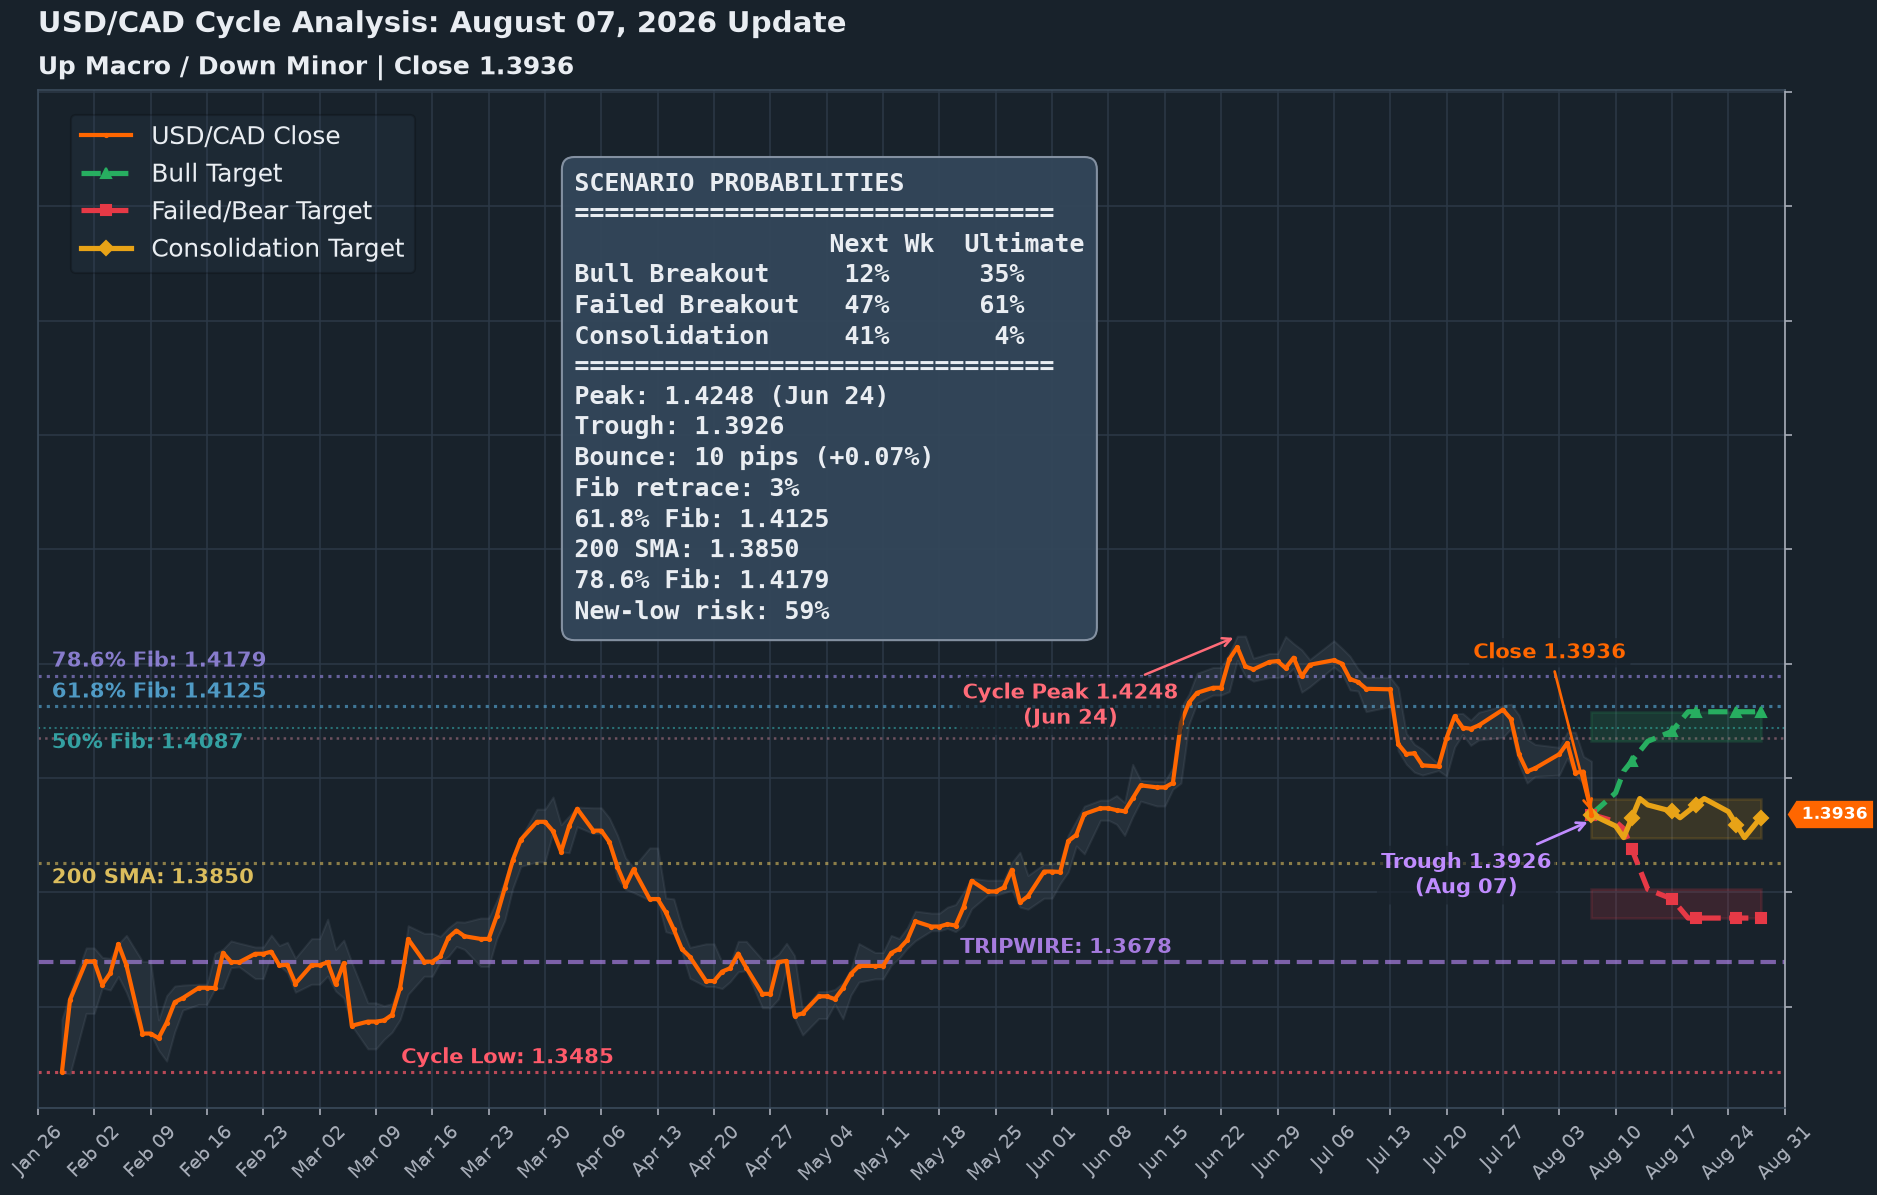
Cycle Update (August 7): a new correction low into the close, with almost no bounce off it yet. USD/CAD closed at 1.3936, an 81-pip decline from the 1.4017 open, after ranging up to a 1.40801 high early in the week and down through a fresh 1.39259 correction low on Friday.
What History Says About This Pullback
The down leg from the June 24 peak at 1.4248 is now 44 days old, a 2.26% decline, and Friday’s 1.39259 print is its lowest close yet, with almost no bounce off it: the recovery off the low measures just 0.07%, against a 3.1% retracement of the decline itself. In other words, the pair is sitting essentially on its low. Sorting a wide set of similar past pullbacks inside prior up-cycles by how the following week played out, that history splits 47% toward the decline extending further, 41% toward an unresolved range, and 12% toward a clean reversal higher; support and resistance confirm which outcome is unfolding rather than setting the odds themselves.
| Consolidation | 41% | 4% | 1.38956–1.39639 |
| Bear Extension | 47% | 61% | Below 1.39113, toward 1.3805–1.37548 |
| Bull Reversal | 12% | 35% | Close above 1.40118, toward 1.40642–1.41158 |
Why It Matters
The 100-day average at 1.39113 is the level that matters immediately, not because it sets the odds above, but because the 1.3936 close sits just 25 pips above it after a decline that has not yet earned a bounce. The upward macro cycle from the January 29 low at 1.34851 to the June 24 high at 1.4248, a 5.66% advance over 146 days, remains intact while price holds above the 1.3678 tripwire, so this stays a correction inside a larger uptrend rather than a confirmed trend change. The 12% odds on a clean reversal higher say the market has not yet validated Friday’s low as a bottom: a low set on a payroll shock, with no retest yet, is the least confirmed kind of low. Overhead, the retracement levels of the 1.4248 to 1.39259 decline stack up at 1.40019 (23.6%), 1.40489 (38.2%), 1.4087 (50%), 1.4125 (61.8%) and 1.41791 (78.6%), with moving-average resistance layered through the same zone at the 10-day average (1.40351), the 21-day (1.40606), the 50-day (1.40703) and, well below the market, the 200-day (1.38505). For hedgers, that argues for using any bounce toward the 1.39113–1.40118 support/resistance band to manage exposure into confirmation rather than assuming either the low or the range holds.
Macro Context
- Cycle structure: the January 29 to June 24 upward macro leg gained 5.66% over 146 days; the 44-day, 2.26% down leg from the 1.4248 peak remains a correction within that structure.
- Tripwire: 1.3678 is the structural level that would invalidate the current upward cycle view.
- Full-retracement risk: a sustained break through the tripwire would expose a slide toward the 1.34851 cycle low, with 1.32 and an extended 1.24 as the next reference levels below that; a resolved move higher instead reopens the longer-run 1.45 to 1.47 area.
Trigger Levels
- Bull: a close above the 5-day average at 1.40118 confirms a reversal and points to the 1.40642–1.41158 zone.
- Bear: a break below the 100-day average at 1.39113 confirms extension and points to the 1.3805–1.37548 zone.
- Neutral: between those triggers, the unresolved outcome remains in force, with a 1.38956–1.39639 five-day range.
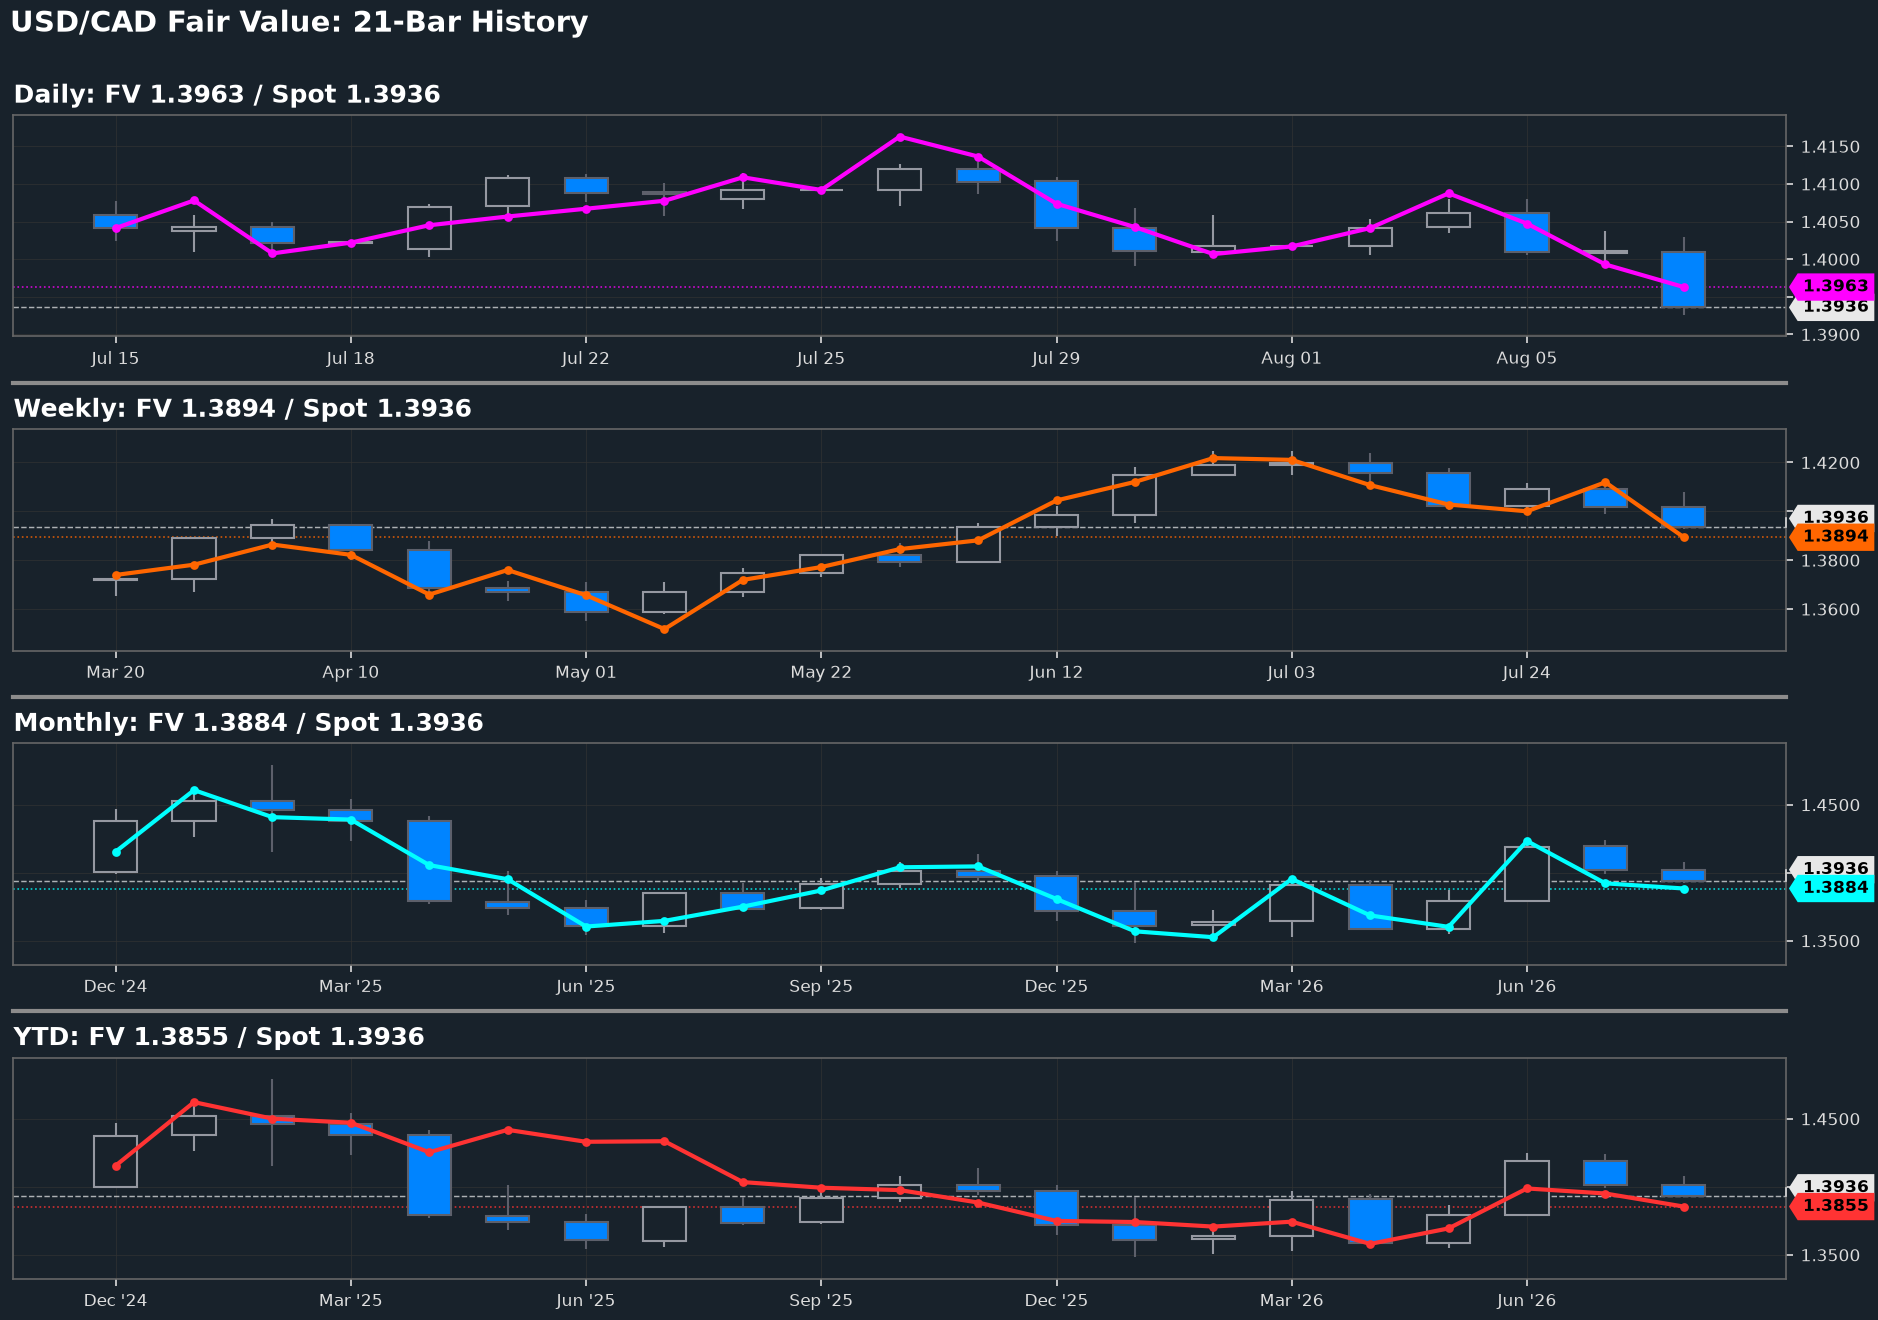
 - The models came down to meet spot rather than spot rallying up to them, which leaves USD/CAD close to fairly valued and hands the next move to momentum. USD/CAD closed at 1.3936, down 0.58% on the week, and the weekly and year-to-date models fell harder still. The weekly read did the work, sliding from 1.4119 to 1.3894, while the monthly sits at 1.3884 and the year-to-date at 1.3855, leaving spot a touch above all three and inside a cent of each. The daily read is the lone model above spot, colour only. The factors pulled both ways: WTI fell 7.67%, which argues for a firmer USD/CAD, but the narrowing US minus Canada two-year spread and a firm equity tape won the week. With every gap inside normal tolerances there is no valuation edge to trade either way, and when the models stop objecting, momentum decides. Momentum has swung the USD buyers’ way, so we would look for further downside near term rather than treat 1.3936 as a floor.
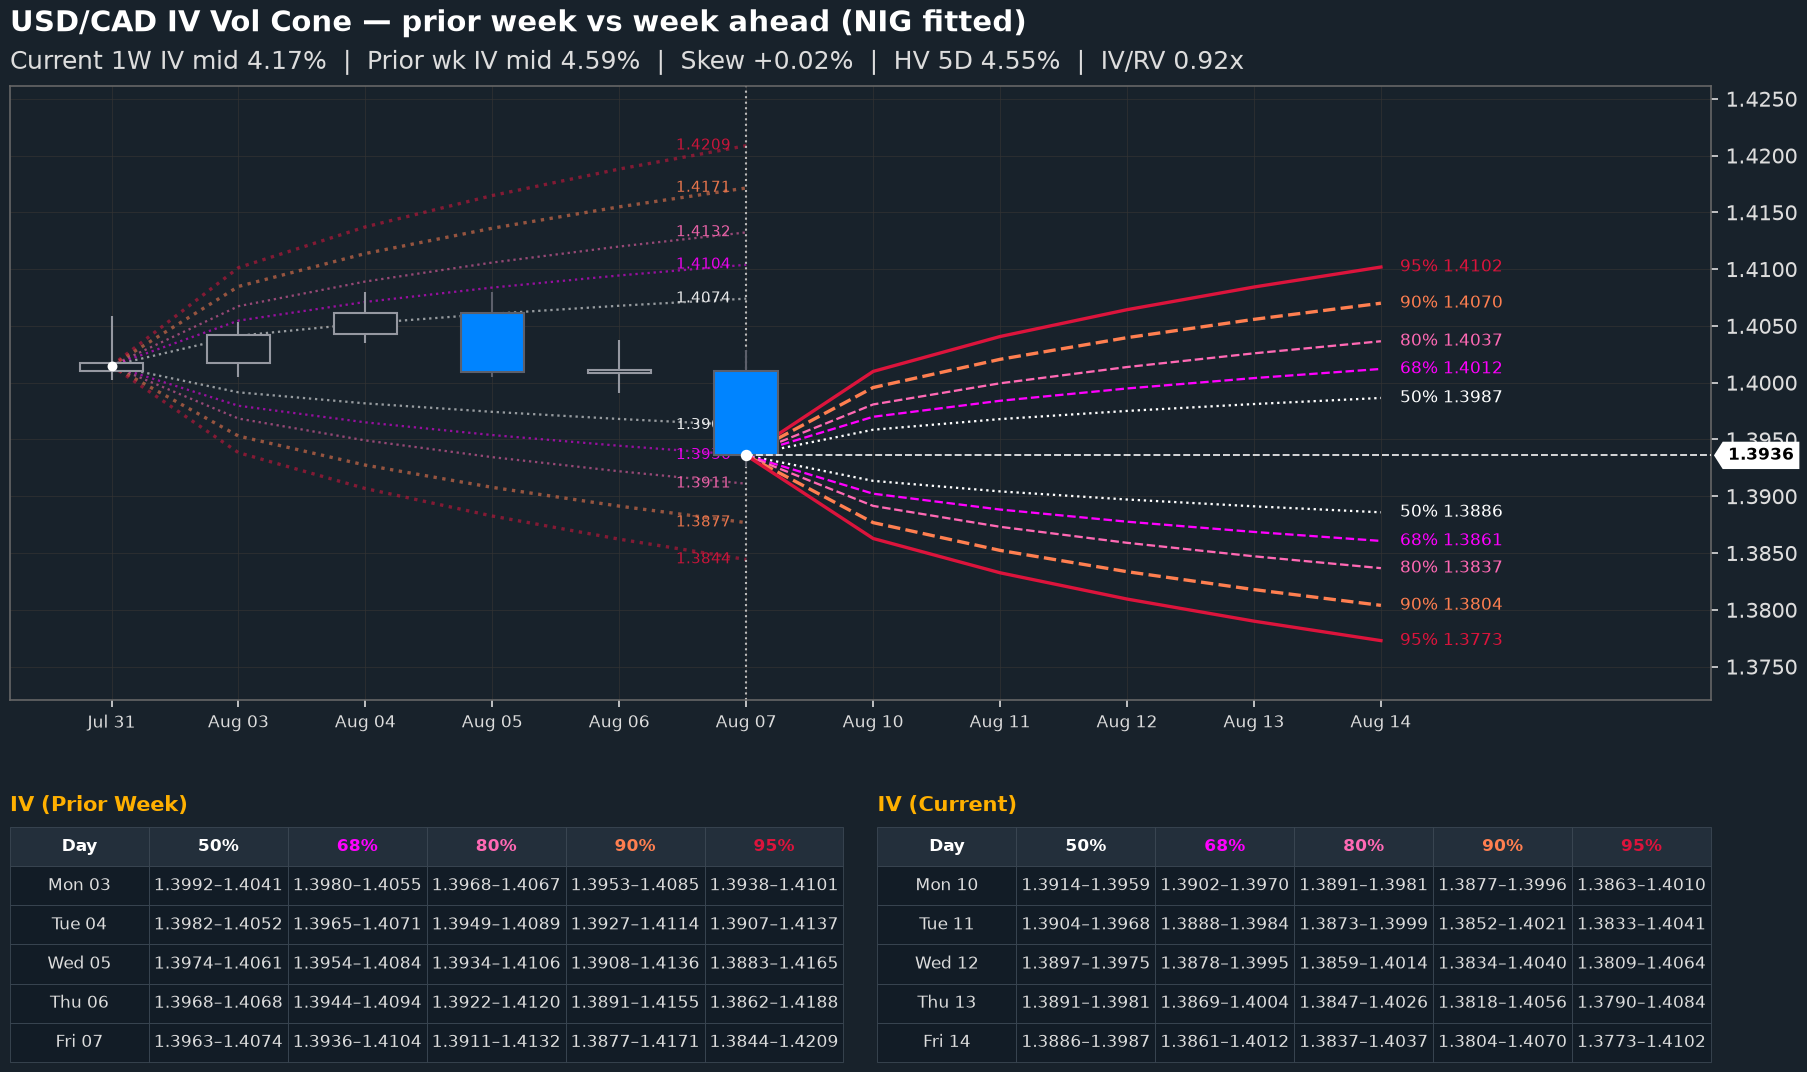
 - One-week implied volatility has dropped to 4.17% from 4.59% a week ago, sitting below the 4.55% realised over the past five days for an IV/RV ratio of 0.92, so USD/CAD optionality is priced cheap heading into a US inflation print. Friday’s soft US payrolls print alongside a blowout Canadian jobs beat did the damage: USD/CAD closed the week at 1.3936, down 0.58% (-81 pips) from 1.4017, inside a 1.39259–1.40801 range. That realised move looks richer than the forward price: one-month IV eased to 4.13% from 4.28%, the curve is still slightly inverted, but far flatter, one-month less one-week just -0.04. The one-week risk reversal fell to 0.02 from 0.52 and the one-month sits at zero, so July’s upside bias is gone, with 25-delta wings at 1.3890–1.3999 (109 pips; 68%: 1.38607–1.40121, 50%: 1.38859–1.39866) where dealer hedging concentrates; a break above 1.3999 or below 1.3890 likely reinforces rather than dampens the move. With Wednesday’s CPI (3.4% headline, 2.5% core) as the main event left, importers and exporters get fairly balanced, historically inexpensive cover on either side of spot, worth using before the print resets the price.
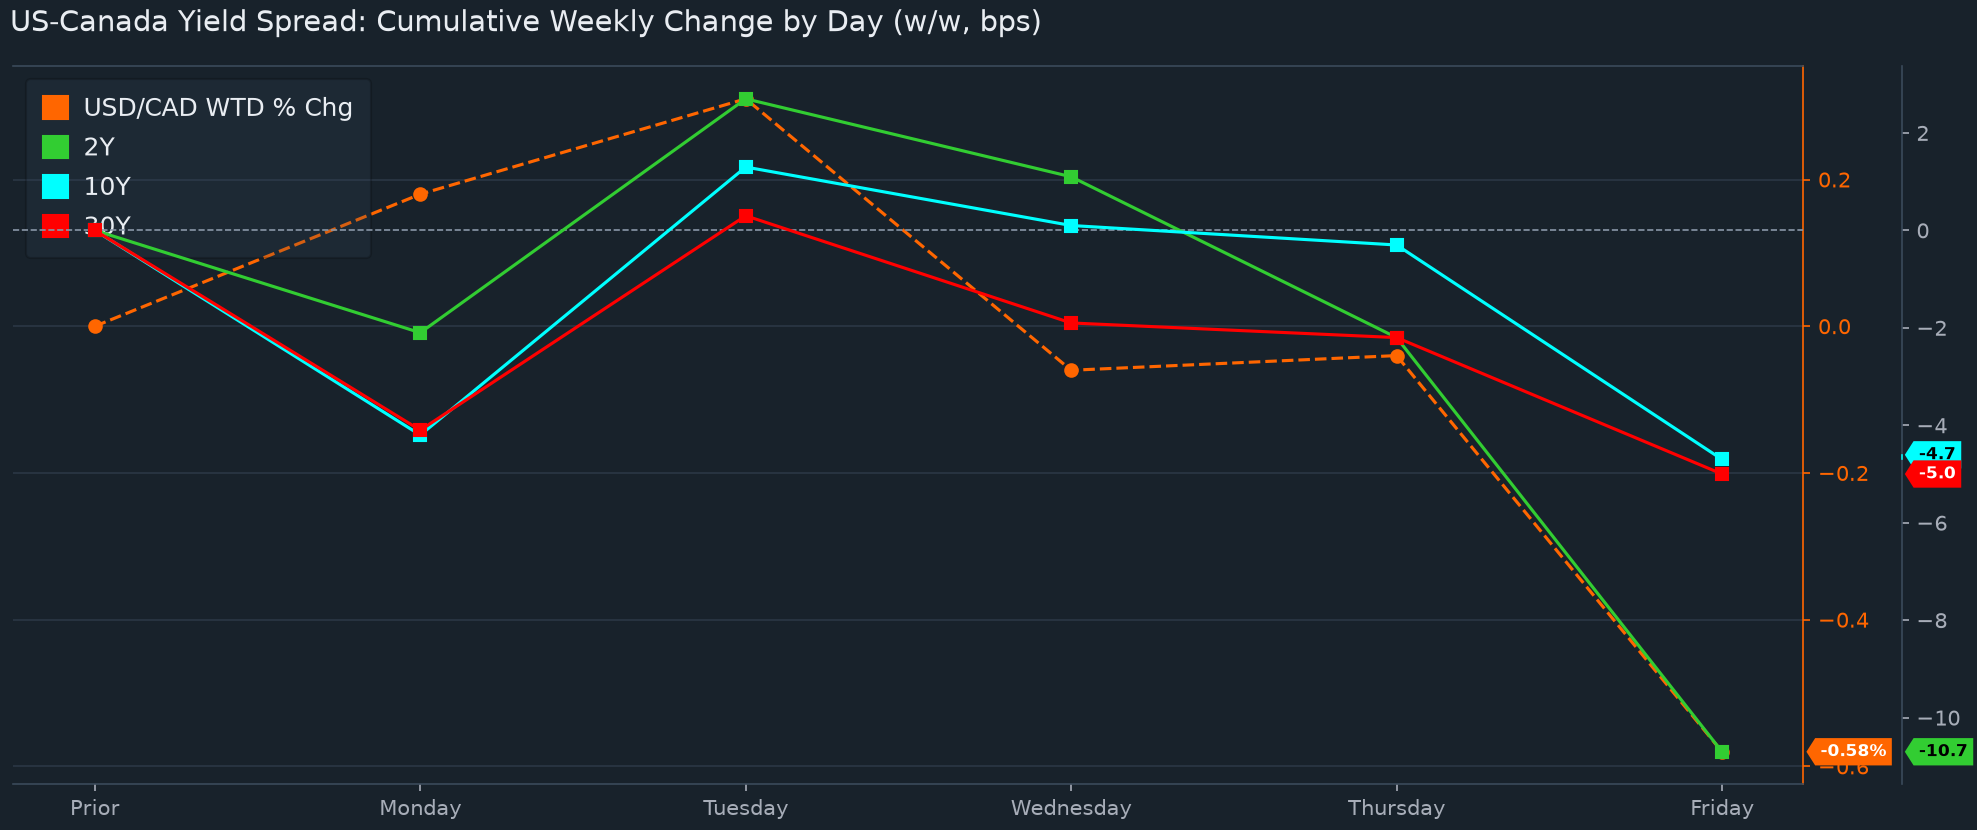
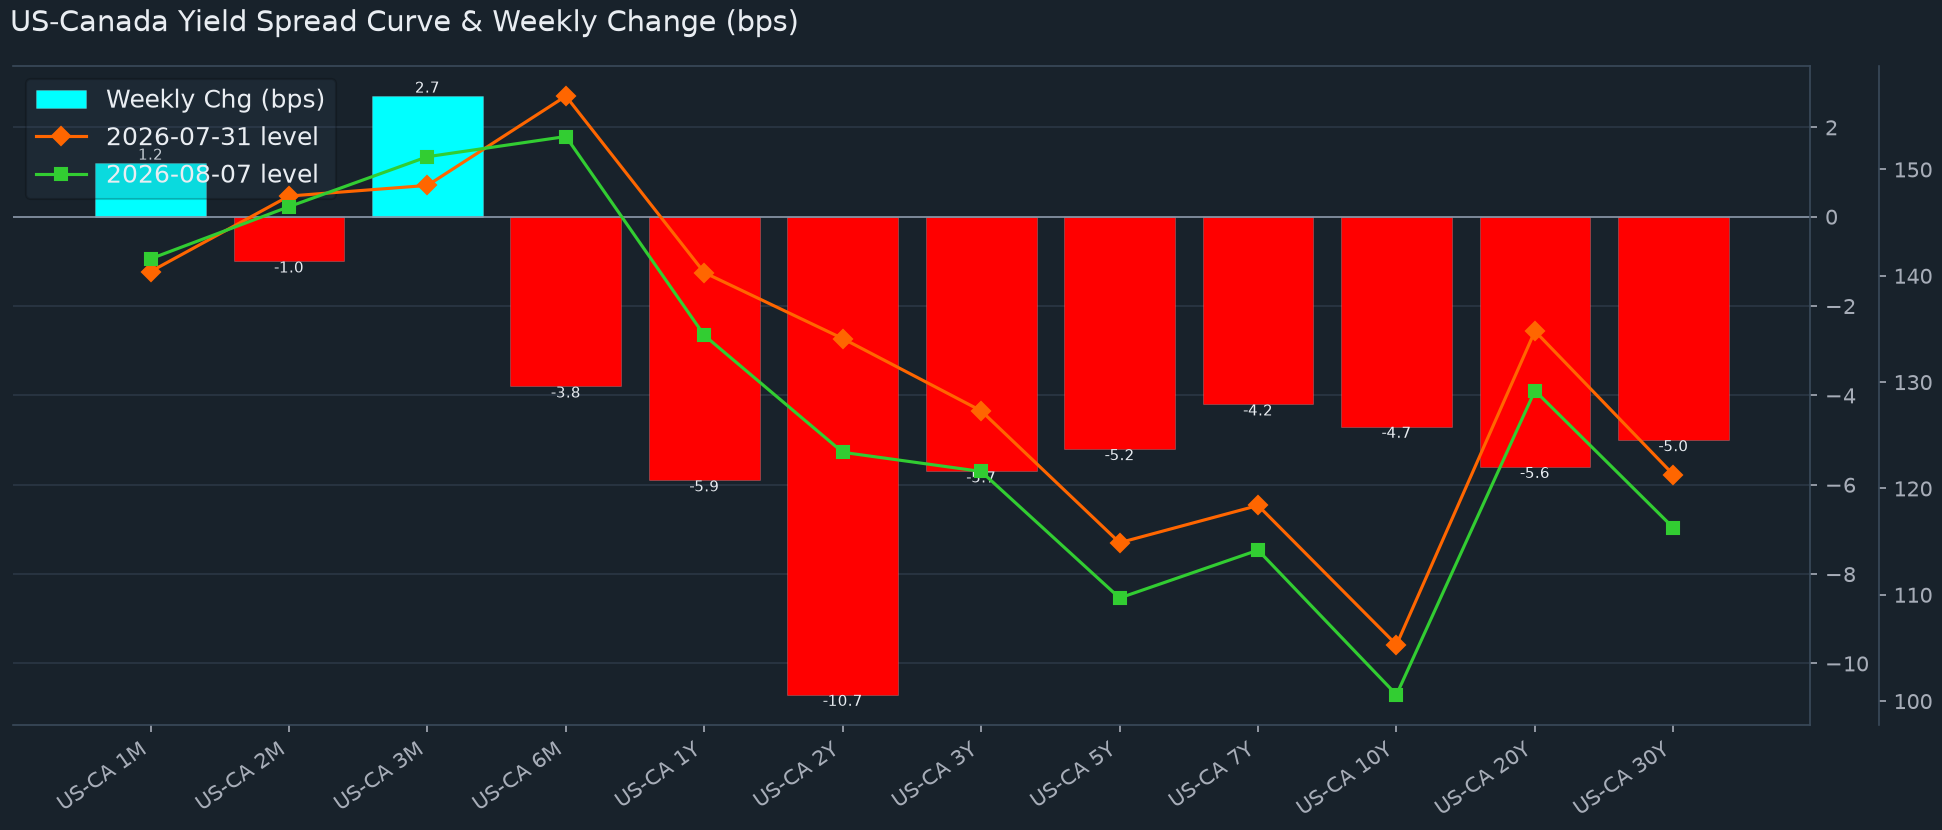
 - Friday’s US payrolls shock did almost all the week’s work, driving the broadest US–Canada spread narrowing of the correction so far and pulling USD/CAD to a fresh weekly low. The 2-year spread, the curve’s most FX-sensitive point, fell 10.7 basis points on the week to 123.4 (from 134.1), more than the prior week’s 7.6 basis-point narrowing, while the 10-year eased 4.7 points to 100.6 and the 30-year gave up 5.0 to 116.3. This was a broad compression, not a front-end-only story: every tenor from 6-month out narrowed together (6M -3.8, 1Y -5.9, 3Y -5.7, 5Y -5.2, 7Y -4.2, 20Y -5.6), while the front stayed mixed, the 1-month up 1.2 basis points to 141.6, the 3-month up 2.7 to 151.2 and the 2-month roughly flat at 146.5. The path was not straight: the 2-year narrowed 2.1 basis points Monday even as USD/CAD gained 0.18%, then reversed Tuesday (2Y +4.8) as USD/CAD rose 0.14%, in line with the usual signal. Wednesday and Thursday resumed the narrowing (-1.6, then -3.3) as USD/CAD fell 0.37% and then held essentially flat (+0.01%), before Friday did the heavy lifting: the 2-year alone gave up 8.5 of the week’s 10.7 basis points, and USD/CAD dropped 0.54% on the day, the bulk of the week’s 0.58% decline, to close at 1.3936 after dipping intraweek to a fresh correction low of 1.39259 from a midweek high of 1.40801. Falling oil (WTI -7.67% on the week) and a 3.46% rally in S&P 500 futures would normally offset each other as CAD crosscurrents, but neither stopped USD/CAD’s slide, a sign rates were firmly in the driver’s seat and a reminder of how fast that can turn: the Fed held at 3.75% in July with three dissents in favour of a hike, and a week and a half later payrolls collapsed. For hedgers, the USD carry advantage is still positive at 123.4 basis points on the 2-year against a 2.25% Bank of Canada policy rate, but it is being withdrawn in one payrolls-sized step rather than a steady grind, the mechanism behind USD/CAD’s slide from 1.4017 to 1.3936. Next week’s US CPI print (Wednesday, headline expected at 3.4% year over year from 3.5%, core at 2.5% from 2.6%) is the next test of whether the compression extends or stalls.
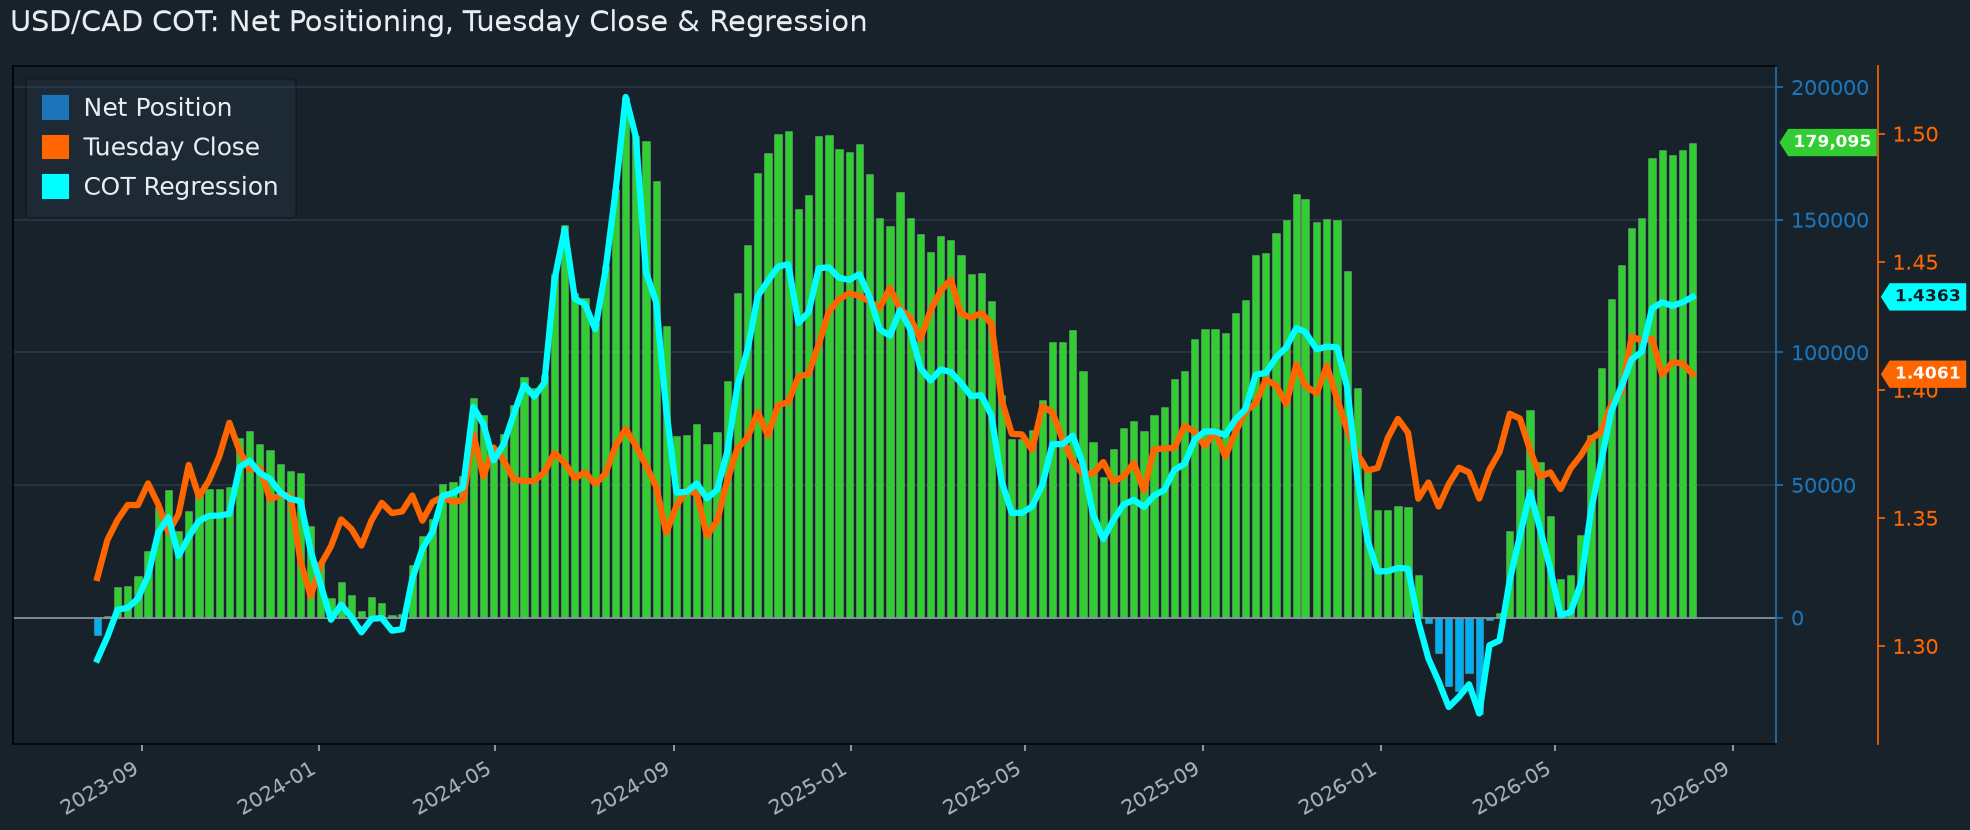
  - Forget the headline net long for a moment: the more useful signal in this report is that ‘Pro’ accounts were closing USD/CAD longs, and the survey shut before the payroll shock that will force the rest. Gross longs fell about 6.2k contracts to 192.6k on the week. That is real liquidation, and it only reads as a 2.8k rise in the net position to 179.1k because shorts were covered faster still, down about 9.0k to 13.5k. The August 4 cutoff came at 1.4061, within 20 pips of the week’s high and three sessions before US payrolls printed -23K against Canada’s 75.1K. Everything that mattered happened after the survey closed, and Friday’s break through the range almost certainly triggered stops and flipped trend-following models that this data cannot yet see. Since positioning of this kind lags price rather than leading it, the reasonable expectation is that the next report shows the net long shrinking, not extending. We would not spend much time on the regression this week: it associates this position with 1.4363 against a 1.3936 close, and a gap that wide has stopped being a valuation signal and become a statement about how far positioning has drifted from the market. The practical point for hedgers is unchanged in direction but sharper in degree. A long this size, held into a macro repricing, is fuel for further downside rather than a floor under it, so treat bounces as opportunities to execute rather than evidence the correction has run its course.
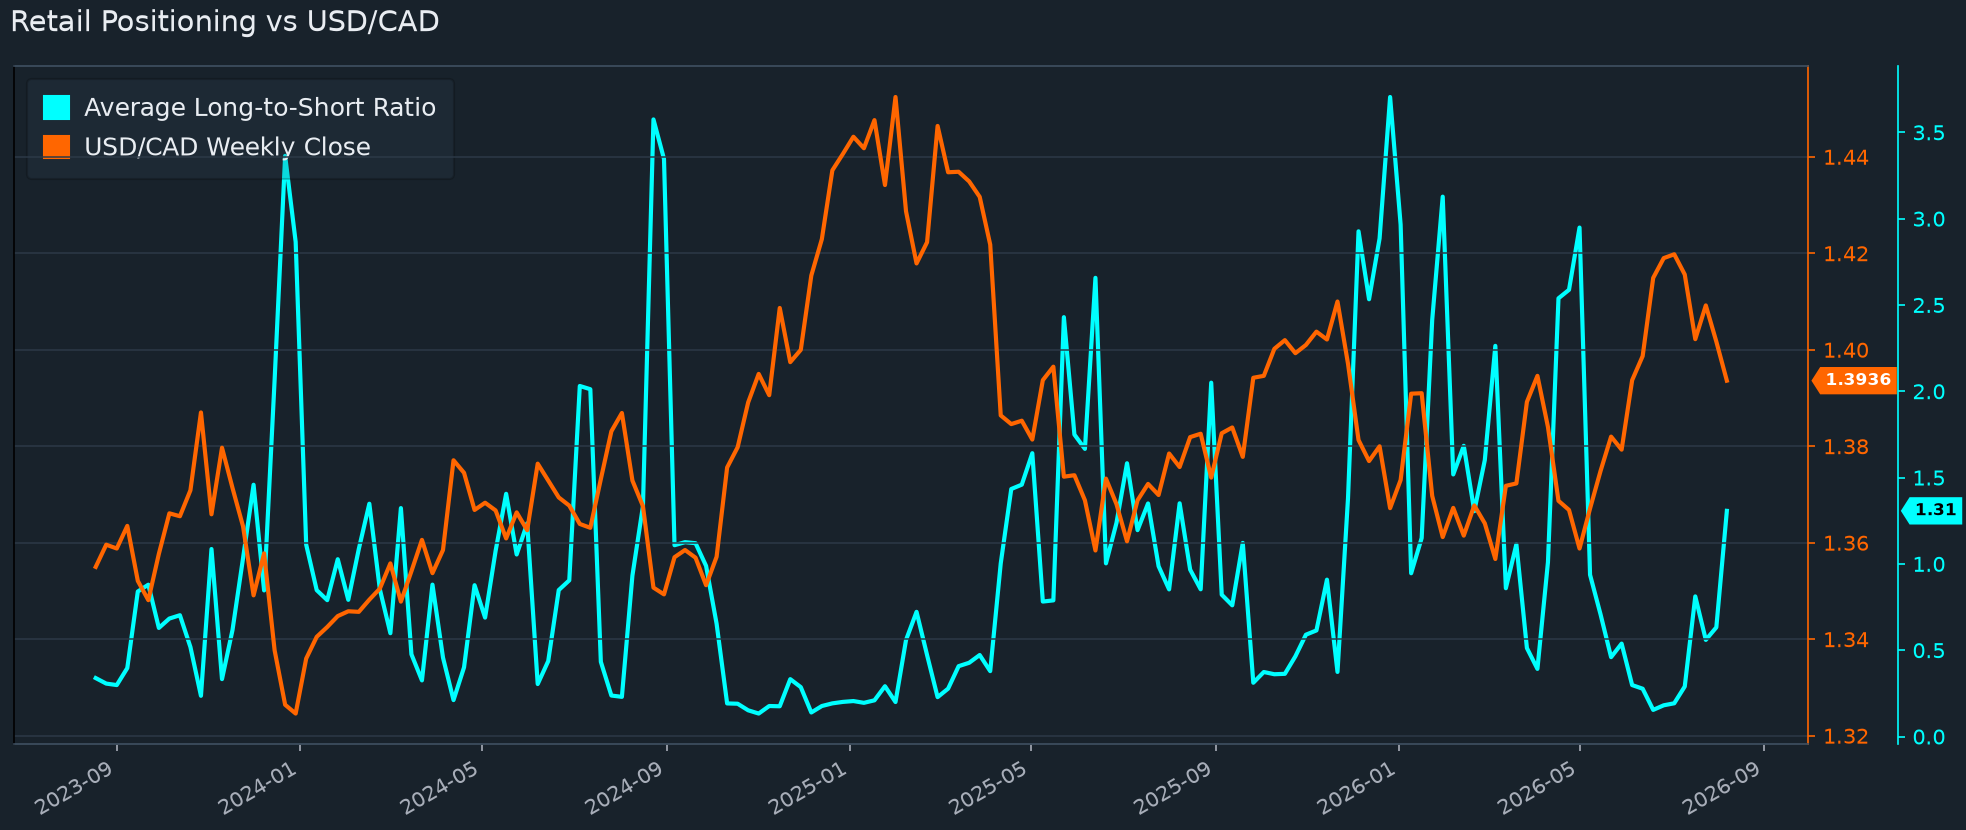
 - Retail flipped from net short to net long USD/CAD in a single week, straight into the break, and on our reading that is another nail in the coffin for the topside. The aggregate long share across six brokers jumped to 56.66% from 38.75%, a 17.91 percentage point swing that pushed the long/short ratio to 1.3073 from below 1.0. The crowd did not sell the move, it bought the dip, and it did so as the pair took out its range and closed at 1.3936 after a 1.3921 intraday low. When retail positions this way the path of least resistance is usually more pain rather than less, because those longs become the supply that feeds the next leg down as they are stopped out. This is a materially stronger contrarian signal than last week’s 38.75% reading, though it is still short of the roughly 70% long share that has marked genuine exhaustion in the past, so treat it as weight of evidence rather than a timing tool. Read alongside professional accounts still carrying a large long into Friday’s repricing, it says both ends of the market are leaning the wrong way. For hedgers the implication is direct: exporters should keep selling into bounces rather than waiting for a recovery the positioning does not support, and importers have little reason to chase USD purchases at current levels.
|
- USD buyers: bid 1.3870, a level this pair has turned on repeatedly all year, and skip the 1.3900 handle entirely. Last week’s 1.3965 and 1.3933 bids both filled as USD/CAD broke to 1.3921 intraday, so importers have already taken two fills on the way down and can afford to be choosier. We would not leave the next order at 1.3900: the double-oh has seldom held a decline in this pair, and the 100-day average just above it at 1.39113 has behaved far more reliably as resistance than as support. 1.3870 is the better bid, having marked the daily low on 1 and 2 April and capped the high on 28 May, with the 200-day average at 1.38505 just beneath it as the next cushion. Below that we would work 1.3830, where the weekly S2 pivot sits at 1.3826, and 1.3790, the densest pivot on the chart under the market. Corrective bounces in this decline have run 72 to 110 pips, which off Friday’s 1.3921 low spans 1.3993 to 1.4031 and is exactly why our sell ladder tops out at 1.4012, so we would not wait for a deep pullback to buy. Stage the cover and use the forward discount, one month at -17.96 and three months at -56.41, for anything hard-dated.
- USD sellers: offer 1.3960, where Friday’s failed rally and two separate retracement measures land on the same handful of pips. Last week’s 1.4050 filled and the 1.4104 and 1.4128 tiers never traded, and we are not repeating that mistake by offering into air. USD/CAD’s one real rally off Friday’s 1.3921 low stalled repeatedly between 1.3945 and 1.3954 through the closing hours and gave all of it back into the settle; the 38.2% retracement of Thursday’s 1.40377 high to that low sits at 1.3966, and the 23.6% retracement of the week’s range sits at 1.3962. At its recent slope the 5-day average projects down to roughly 1.3965 by Friday, so the market should come to us rather than the other way round. The second offer is 1.3990, which held as support the past two Thursdays and is close to where the 10-day average projects, and the 1.3981 weekly pivot sitting between the two rungs is what gives us confidence one of them fills. We would cap the ladder at 1.4012, today’s 5-day average. Do not reach higher: this was a macro repricing on negative US payrolls against a 75.1K Canadian jobs beat, not a positioning wobble, and absent a fresh geopolitical shock we doubt next week offers much of a bounce at all. Exporters needing a fill regardless should sell near spot at 1.3936.
|
|
Utilizing FX Option pricing and combining probability theory and statistics, we present below, for the coming week and the upcoming month, what the numbers "suggest" for USD/CAD pricing, ranges, and probabilities using a normal distribution. The option strikes we used are noted inside the parentheses() in the row headers "Prob. Price Above Upper Boundary ( )" for the call option, and "Prob. Price Below Lower Boundary ( )" for the put option.
|
| Prob. Price Above Upper Boundary (1.3999) |
20.29% |
41.83% |
| Prob. Price Below Lower Boundary (1.3890) |
30.10% |
58.30% |
| Implied Range (60% Probability) |
- |
1.3897 - 1.3975 |
| Implied Range (40% Probability) |
- |
1.3873 - 1.4000 |
| Implied Range (30% Probability) |
- |
1.3857 - 1.4016 |
| Implied Range (20% Probability) |
- |
1.3837 - 1.4037 |
| Implied Range (10% Probability) |
- |
1.3804 - 1.4070 |
| Implied Range (5% Probability) |
- |
1.3773 - 1.4102 |
| Prob. Price Being Between Boundaries (1.3890 - 1.3999) |
49.61% |
100.00% |
| Prob. Either Boundary Touched (1.3890 - 1.3999) |
- |
91.64% |
| Prob. Neither Boundary Touched (1.3890 - 1.3999) |
- |
8.36% |
| Prob. Price Touching Both Boundaries (1.3890 - 1.3999) |
- |
8.54% |
|
| Prob. Price Above Upper Boundary (1.4046) |
22.87% |
49.01% |
| Prob. Price Below Lower Boundary (1.3814) |
27.49% |
51.64% |
| Implied Range (60% Probability) |
- |
1.3852 - 1.4021 |
| Implied Range (40% Probability) |
- |
1.3799 - 1.4074 |
| Implied Range (30% Probability) |
- |
1.3765 - 1.4109 |
| Implied Range (20% Probability) |
- |
1.3721 - 1.4155 |
| Implied Range (10% Probability) |
- |
1.3650 - 1.4228 |
| Implied Range (5% Probability) |
- |
1.3584 - 1.4298 |
| Prob. Price Being Between Boundaries (1.3814 - 1.4046) |
49.64% |
100.00% |
| Prob. Either Boundary Touched (1.3814 - 1.4046) |
- |
91.84% |
| Prob. Neither Boundary Touched (1.3814 - 1.4046) |
- |
8.16% |
| Prob. Price Touching Both Boundaries (1.3814 - 1.4046) |
- |
8.72% |
|
|
Definitions: "At Period End" means that the prices/probabilities represented under that header are expected to be relevant on that terminal day. In contrast, "At Any Time During Period" suggests that the numbers in the column below the header are likely to occur and be valid at any point during the date range given. "Prob. Price Above Upper Boundary" is the chance that the price will close above the upper boundary at the final date irrespective of where it may trade up until then. "Prob. Price Below Lower Boundary" is the chance that the price will close below the lower boundary at the final date irrespective of where it may trade up until then. "Implied Range (x% Probability)" is the range that the currency is expected to trade within given a certain probability. In other words, an Implied Range (60% probability) suggests that the exchange rate has a 60% chance of staying within that given range (e.g., 1.2500-1.2600) over the time period. "Prob. Price Being Between Boundaries" is the probability the price will end between the two boundaries "At Period End" or the probability the price will trade inside the boundaries "At Any Time During Period". "Prob. Either Boundary Touched" is the probability that either the upper or lower boundary will be touched at any point during the date range specified. Prob. Neither Boundary Touched is the probability that neither the upper nor lower boundary will be touched at any point during the date range specified. Prob. Price Touching Both Boundaries is the probability that both the upper and lower boundary will be touched at some point during the date range specified.
|
Quick Take:
- Wednesday’s US inflation report is the only scheduled release that can genuinely reset USD/CAD this week. Headline CPI is expected to slow to 3.4% year-on-year from 3.5% and to rise 0.1% on the month after a 0.4% decline, with core seen at 2.5% from 2.6% and 0.2% on the month after a flat June; a minority of forecasters look for 3.3% on the headline. Coming directly after a payroll report that printed -23K, a cool number lets the market keep pricing the Fed away from the hike its three July dissenters wanted, while a hot one revives the least comfortable mix the dollar can face: a labour market that is shrinking and prices that are not.
- Canada has almost nothing on the calendar, so the loonie carries Friday’s momentum rather than building on it. Building permits on Wednesday follow a 1.7% decline, and Friday brings June wholesale sales, expected up 2.7% after a flat month. None of that is a rate-setting input. With the policy rate at 2.25% and core inflation contained, the domestic side is a spectator this week and CAD direction is a US data trade.
- USD/CAD starts under every short-term average after a 0.58% decline to 1.3936. The 5-, 10-, 21- and 50-day averages sit at 1.4012, 1.4035, 1.4061 and 1.4070, and the week’s 1.39259 low is a fresh correction low; only the 100-day at 1.3911 and the 200-day at 1.3851 sit beneath spot. The rate mechanism behind it sits at the front end: the US-Canada 2-year spread compressed 10.7 basis points to 123.4 last week, a larger move than the prior week’s 7.6 basis point narrowing, so the dollar’s carry advantage is being withdrawn rather than merely paused. That puts the realistic bounce zone at 1.3960 to 1.4012, capped by the falling 5-day average, and leaves 1.3870 as the first support we would actually bid.
- Options are cheap and the crowd is offside, which is the week’s most useful asymmetry. One-week implied volatility is 4.17% against 4.55% realised over the past five days, and the 68% working range is 1.3861 to 1.4012. Retail flipped to 56.66% long from 38.75% while professional accounts still carry a 179.1K net USD/CAD long struck before Friday’s break. Protection is inexpensive and the crowded side is USD-long, so this is a week to buy cover rather than to predict.
An empty North American calendar hands Monday to positioning. There is no scheduled US or Canadian release of consequence, so the session tests whether Friday’s move holds once the initial reaction has cleared. Two cross-currents frame it. WTI fell 7.67% over the past week, a terms-of-trade drag the loonie simply declined to take on Friday, while S&P 500 futures rose 3.46%, a risk backdrop that normally helps CAD. If the pair opens heavy and cannot reclaim the 5-day average at 1.4012, the burden stays on USD buyers; a quiet drift back toward 1.3981, the weekly pivot, would be the more neutral outcome. The 100-day average at 1.3911 is the level that tells us whether Friday was an event spike or the start of something with follow-through.
Second-tier data opens the week, and the energy reports carry more weight than the prints. Existing home sales are expected at 4.06M after 4.09M, and the weekly private payroll series follows a 15.00K reading that has been decelerating for weeks. None of that moves a rate curve on its own. The live input for USD/CAD is energy: the monthly short-term energy outlook and the weekly industry crude estimate land the same day, after a week in which crude gave up 7.67% and the last official inventory report showed a 2.479M build against expectations of a draw. Another bearish oil signal would finally give USD/CAD a reason to bounce that has nothing to do with the dollar, and it is the most plausible source of a rally into the 1.4000 area early in the week.
Inflation day is Wednesday, and the whole week hinges on it. Headline CPI is expected at 0.1% on the month and 3.4% on the year against 3.5%, with core at 0.2% and 2.5% against 2.6%. The composition matters more than the headline: last week’s services survey showed prices paid at 70.3 against 65.0 expected even as the employment component fell to 47.4, so a core print that confirms sticky services inflation alongside a shrinking payroll count is the genuinely awkward outcome, and it is the one that would most quickly rebuild a US front-end premium. A soft core does the opposite and extends the current move. Canada’s building permits follow a 1.7% fall, the monthly oil market reports land the same morning, and official crude inventories follow last week’s 2.479M build. Expect the pair to trade the first fifteen minutes and then the revision detail.
Producer prices and claims give the inflation story its second reading on Thursday. Headline PPI is expected at 0.2% after a 0.3% decline and the core measure at 0.3% after 0.2%, while initial claims follow 199K and continuing claims 1,801K, the highest continuing-claims print in three weeks. The claims series is the one to watch: Friday’s payroll drop was accompanied by an unemployment rate that fell to 4.1%, which happened only because participation slipped to 61.4%, so a genuine deterioration in labour demand should start showing up in continuing claims before it shows up anywhere else. A firm PPI alongside rising continuing claims would reinforce exactly the stagflationary read that Wednesday’s CPI could open up.
Retail sales close the week and hand Canada its only real input. US retail sales are expected at 0.2% on the month after 0.2%, the ex-auto measure at 0.2% after a 0.2% decline, and the control group follows a 0.5% gain; consumer sentiment is seen at 54.0 after 55.2 with one-year inflation expectations last at 4.2%. On the Canadian side, June wholesale sales are expected up 2.7% after a flat month. Those Canadian numbers are backward-looking and will not move the Bank of Canada, but they do speak to a second-quarter growth run that has been firmer than the market assumed, and combined with Friday’s 75.1K employment gain and the drop in the jobless rate to 6.4% they make it harder to argue the domestic economy needs easier policy. The consumer detail on the US side is the more tradable half.
The conditional bias stays with selling USD/CAD rebounds while the correction holds beneath the average cluster. Last week’s 1.3965 and 1.3933 buyer levels both filled as the pair broke to 1.39259, and the 1.4050 seller level filled on the way through the week’s 1.40801 high, so both sides of the prior plan did their job and the map now resets lower. Exporters should work 1.3960, where Friday’s failed rally high at 1.3954 meets the 38.2% retracement of Thursday’s high to Friday’s low at 1.3966 and the 23.6% retracement of the week’s range at 1.3962, then a second offer at 1.3990, which held the past two Thursdays and is where the 10-day average projects by Friday. We would cap the ladder at 1.4012. Importers should skip the 1.3900 handle, which has seldom held a decline, and bid 1.3870 instead, a level that marked the daily low on 1 and 2 April and capped the high on 28 May, then 1.3830 and 1.3790 beneath it. Our cycle model assigns 47% to down-leg extension, 41% to an unresolved correction and 12% to a reversal. Fair value does not stand in the way: the weekly model at 1.3894, the monthly at 1.3884 and the year-to-date at 1.3855 have all come down with spot and now sit within a cent of Friday’s close, well inside normal tolerances, so valuation neither backs the move nor argues against it. The honest summary is that the trend is lower, valuation is neutral, and the crowd is leaning the wrong way, so we would be more aggressive on the downside than the topside and sell into the 1.3950s and 1.3960s rather than wait for a rebound the positioning does not support. A close back above the 50-day average at 1.4070 would be the first genuine repair of the structure, and Wednesday is the most likely day to produce it.
|
|
|