
Understanding why a forward point moved, checking where the cross-border spread sits before pricing a hedge, and seeing whether a curve move was the front end, the long end, or all of it.
Client tool
Bond Yields
US and Canada government yields by tenor, the full curve on any trading day, and the spread between the two countries.
Client access required
What it does
Twelve tenors from one month to thirty years, for both Canada and the United States, going back to 1971. Read one tenor over time, or switch to the curve view and lay several trading days on top of each other to see how the whole term structure has moved. Every view can be flipped to the US-less-Canada spread, which is the number that sets the forward points on a CAD hedge.
Access note: Bastion provides paid, approved access for clients, subscribers, and time-limited demo users. Newsletter access and tool permissions may be managed separately.
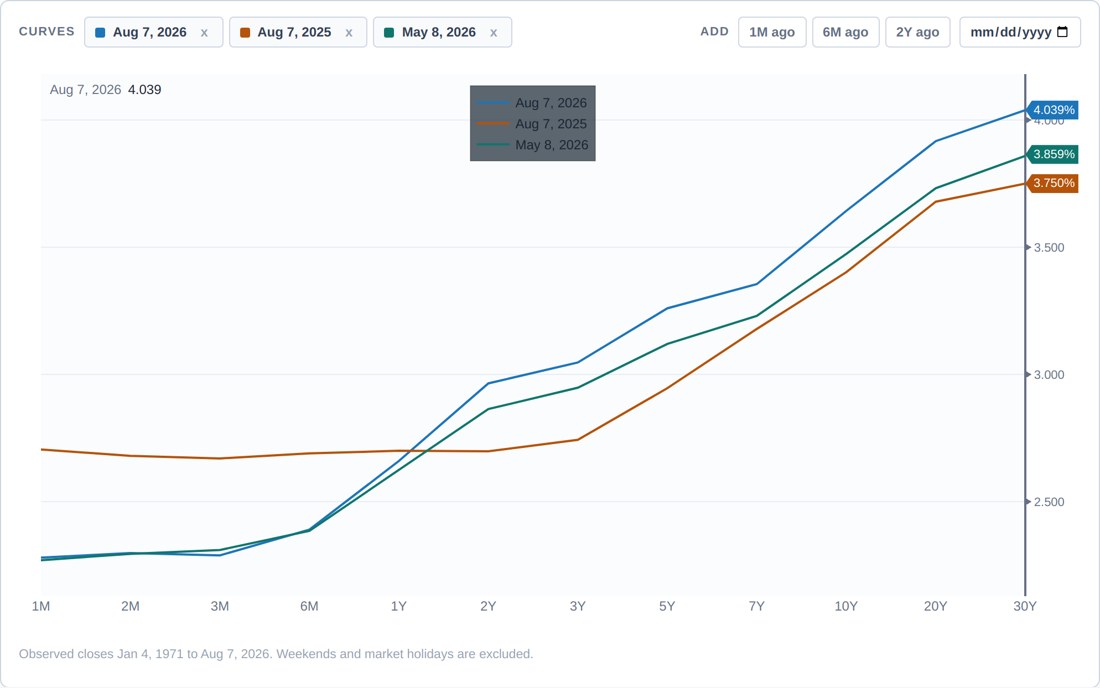
Three Canadian curves on one chart: today, three months ago, and a year ago.
Executing on a quoted level. The intraday reading is indicative and the history behind it is observed closes, neither of which is a tradeable price.
How clients use it
The rate differential, without exporting anything.

Track
- Follow any tenor over time, or up to six at once, in yield terms or as the US-less-Canada spread.

Compare
- Overlay curves from different dates to separate a front-end repricing from a genuine shift in the whole structure.

Explain
- Show a board or a lender exactly which part of the curve moved, with the observed closes behind it.
What is shown, and what is not
The history is observed daily closes sourced from TradingView, with Investing.com kept alongside as a cross-check. On top of that, each tenor carries a live intraday reading during the cash session, drawn as a dotted stub off the last close and labelled with the time it was taken, so it can never be mistaken for a settled figure. Once the session ends and the close is captured, the reading becomes that day's close. Weekends and statutory holidays are left out rather than carried forward: a bond market that was closed did not hold its yield steady, it simply did not trade, and a flat line across a long weekend would misrepresent that. Where a requested curve date falls on a closed day, the tool shows the prior trading day and says so. Spreads are only calculated where both countries were quoted on the same date, so a Canadian holiday cannot show up as a spread move that never happened.
Important limitations
These tools provide informational market context only. Market data, option data, indicators, calendar events, technical summaries, and newsletter commentary may be delayed, indicative, incomplete, or based on third-party sources. They should not be treated as personalized investment advice, a guarantee of outcome, or a stand-alone instruction to trade or hedge.
Request access to Bond Yields.
Tell us what treasury work you are trying to support, which currencies matter, and whether you need client, newsletter, or demo access.