
Reading Canadian data against its US counterpart before a hedge, pricing, or budget-rate conversation, and checking what a central bank has actually done rather than what was reported.
Client tool
Economic Data
Canadian and US macro indicators, taken directly from the issuing agencies and charted against each other.
Client access required
What it does
Policy rates, inflation, labour, and activity indicators for Canada and the United States, published by the Bank of Canada and the Federal Reserve Bank of St. Louis and charted on the same interactive engine as the rest of the client tools. Any two indicators can be put on one chart, each keeping its own value axis, so a Canadian print can be read directly against its US counterpart.
Access note: Bastion provides paid, approved access for clients, subscribers, and time-limited demo users. Newsletter access and tool permissions may be managed separately.
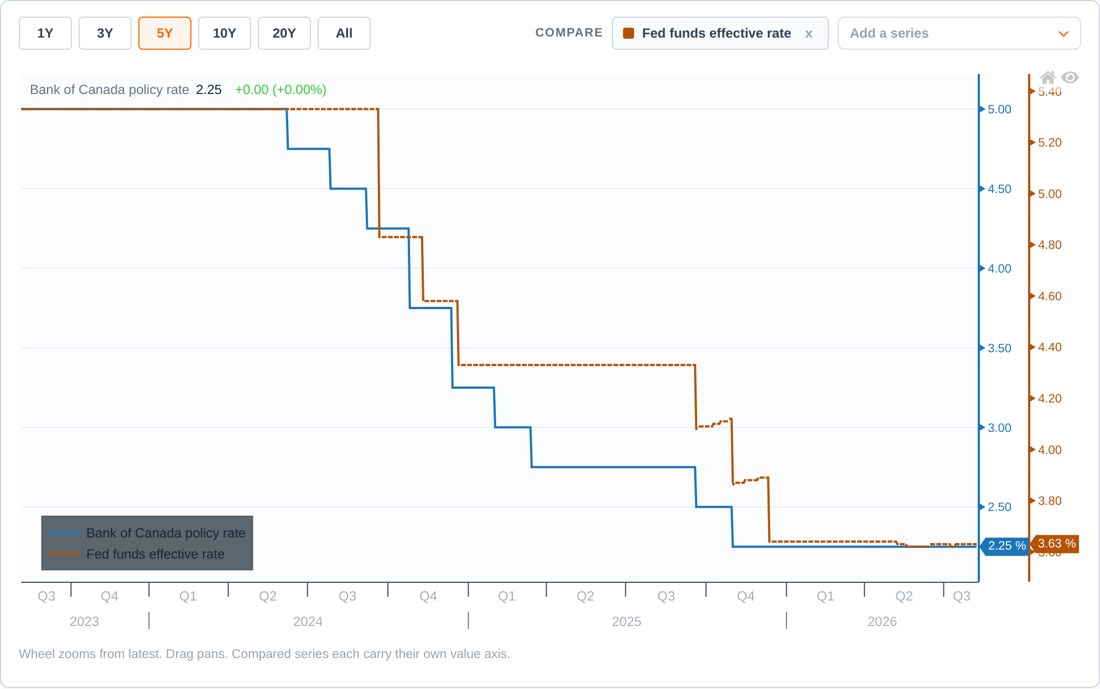
The policy spread that drives forward points, on one chart, without exporting anything to a spreadsheet first.
Forecasting a release, or replacing the specific series your auditors, lenders, or contracts require you to cite.
How clients use it
One number, one source, no spreadsheet in between.

Track
- Follow the policy rates, inflation measures, and labour data that move USD/CAD and the cost of carry on a hedge.

Compare
- Put a Canadian series and its US counterpart on one chart, each on its own axis, to see where the gap has actually moved.

Cite
- Export the series with its source, units, and the provider's own series code attached, so a figure in a board pack can be traced back.
Sources and revisions
Figures come from the Bank of Canada's Valet service and the Federal Reserve Bank of St. Louis (FRED), and each series is shown with the provider's own series code. Official statistics are routinely restated after first publication; where a figure has been revised since we recorded it, the tool marks it rather than quietly replacing the number you saw last time. Bond yields are not shown here, they are covered by their own tool on a curve convention Bastion maintains.
Important limitations
These tools provide informational market context only. Market data, option data, indicators, calendar events, technical summaries, and newsletter commentary may be delayed, indicative, incomplete, or based on third-party sources. They should not be treated as personalized investment advice, a guarantee of outcome, or a stand-alone instruction to trade or hedge.
Request access to Economic Data.
Tell us what treasury work you are trying to support, which currencies matter, and whether you need client, newsletter, or demo access.